present
Zarejestruj się i otrzymaj 50 $ zniżki na pierwszy zakup
Trading product for Smart Liquidity Matrix Wskaźnik Premium/Discount  Fair Value Gap, image 1
Smart Liquidity Matrix
Wskaźnik
Wersja 1.0, Sep 2026
Windows, Mac
4.2
Opinie: 5
Trading product for Smart Liquidity Matrix Wskaźnik Premium/Discount  Fair Value Gap, image 2
Trading product for Smart Liquidity Matrix Wskaźnik Premium/Discount  Fair Value Gap, image 3
Trading product for Smart Liquidity Matrix Wskaźnik Premium/Discount  Fair Value Gap, image 4
Trading product for Smart Liquidity Matrix Wskaźnik Premium/Discount  Fair Value Gap, image 5
Trading product for Smart Liquidity Matrix Wskaźnik Premium/Discount  Fair Value Gap, image 6
Trading product for Smart Liquidity Matrix Wskaźnik Premium/Discount  Fair Value Gap, image 7
Trading product for Smart Liquidity Matrix Wskaźnik Premium/Discount  Fair Value Gap, image 8
Trading product for Smart Liquidity Matrix Wskaźnik Premium/Discount  Fair Value Gap, image 9
Trading product for Smart Liquidity Matrix Wskaźnik Premium/Discount  Fair Value Gap, image 10
Trading product for Smart Liquidity Matrix Wskaźnik Premium/Discount  Fair Value Gap, image 11
16
Sprzedaż
333
Bezpłatne instalacje

Opis

Smart Liquidity Matrix oznacza strukturę pozostawioną przez instytucjonalny przepływ zleceń i utrzymuje

bieżący odczyt tego samego układu na dwudziestu czterech ramach czasowych jednocześnie.


CO RYSUJE


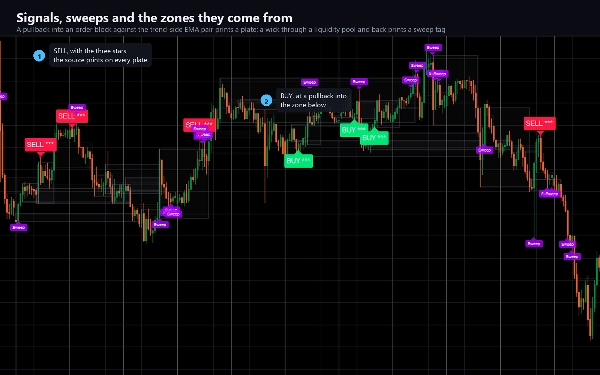
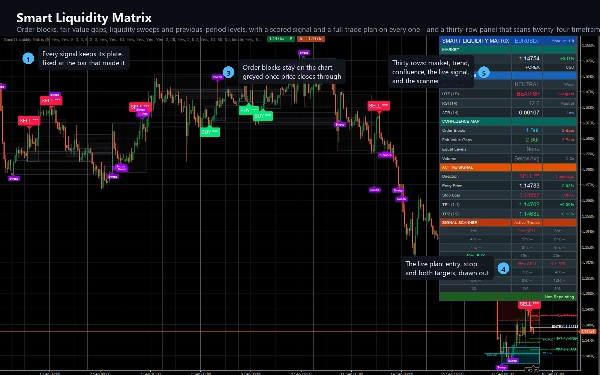
Bloki zleceń. Przy każdym potwierdzonym wahnięciu ostatnia przeciwna świeca przed ruchem jest zaznaczona ramką. Strefa

pozostaje aktywna, dopóki cena nie zamknie się przez nią, następnie jest przyciemniana zamiast znikać, dzięki czemu nadal

można zobaczyć, gdzie się znajdowała.


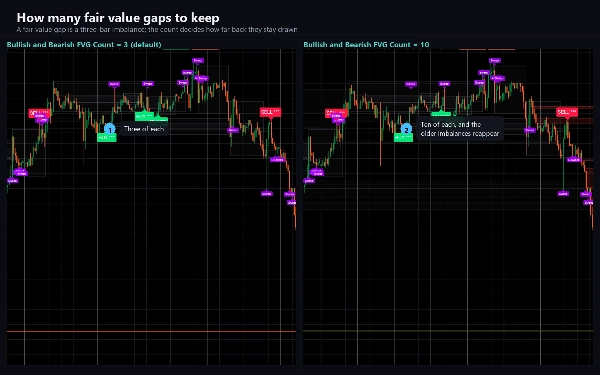
Luki wartości godziwej. Nierównowagi trzyświecowe, rysowane w momencie ich powstania i przyciemniane, gdy cena zamyka się ponownie

przez nie.


Równe maksima i minima. Wahnięcia, które pokrywają się w granicach jednej dziesiątej aktualnego ATR, są łączone przerywaną

linią i oznaczane jako EQH lub EQL. To są pule, które polują na zlewy płynności.


Zlewy płynności. Gdy cena przebija równe poziomy lub poprzednie maksimum lub minimum okresu i

zamyka się ponownie wewnątrz, słupek jest oznaczany. Każdy zlew może wywołać alert.


Poziomy i równowaga poprzedniego okresu. Poprzednie maksimum i minimum dnia, rysowane z własnym blaskiem,

oraz linia pięćdziesięciu procent między aktualnym maksimum i minimum wahnięcia.


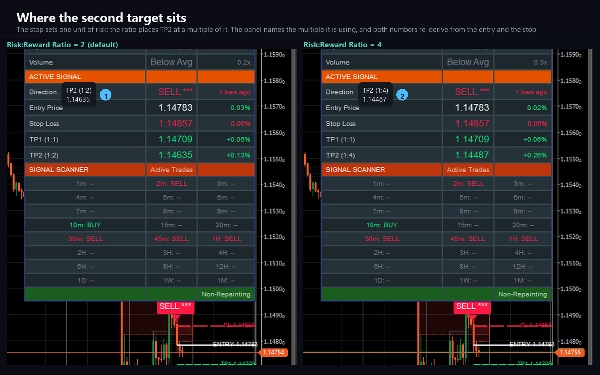
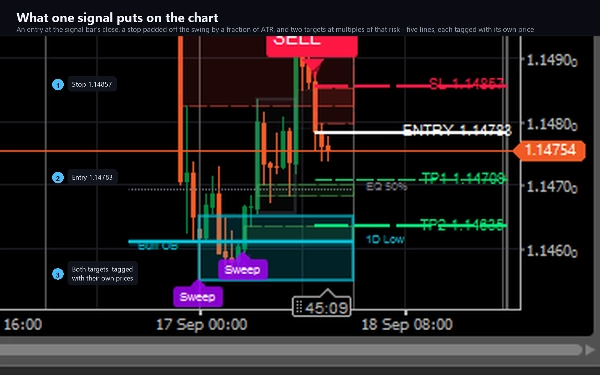
Sygnały kupna i sprzedaży z obrazem ryzyka. Wejście po cofnięciu przeciwko parze EMA po stronie trendu, z

wejściem, stopem i dwoma celami narysowanymi po prawej stronie słupka i oznaczonymi ich cenami.


SKANER


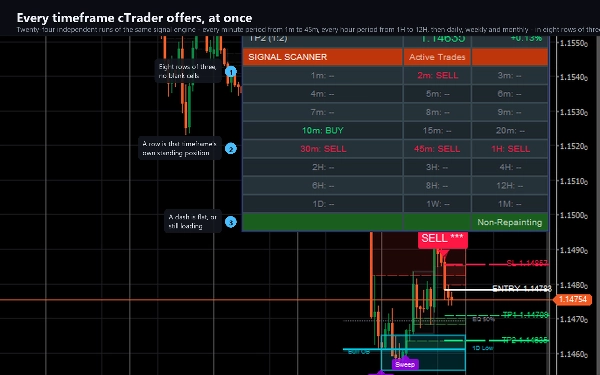
Dolna jedna trzecia panelu uruchamia tę samą logikę sygnałów na dwudziestu czterech ramach czasowych

niezależnie, od jednej minuty do jednego miesiąca, i pokazuje, czy każdy z nich obecnie utrzymuje pozycję długą,

krótką lub brak pozycji. Zgoda między sąsiednimi wierszami jest kluczowa: sygnał sprzedaży na trzydzieści minut,

czterdzieści pięć minut i jedną godzinę razem odczytuje się zupełnie inaczej niż pojedynczy sygnał w jednym wierszu.


Te dwadzieścia cztery to wszystkie standardowe okresy czasowe oferowane przez cTrader: jedna, dwie, trzy, cztery, pięć, sześć,

siedem, osiem, dziewięć, dziesięć, piętnaście, dwadzieścia, trzydzieści i czterdzieści pięć minut, następnie jedna, dwie, trzy, cztery,

sześć, osiem i dwanaście godzin, potem dzienny, tygodniowy i miesięczny. Każdy jest odczytywany z tych samych danych słupka

co wykres, więc nic tutaj nie zależy od historii ticków twojego brokera, i wypełniają dokładnie osiem wierszy po trzy

bez pustych komórek.


PANEL STEROWANIA


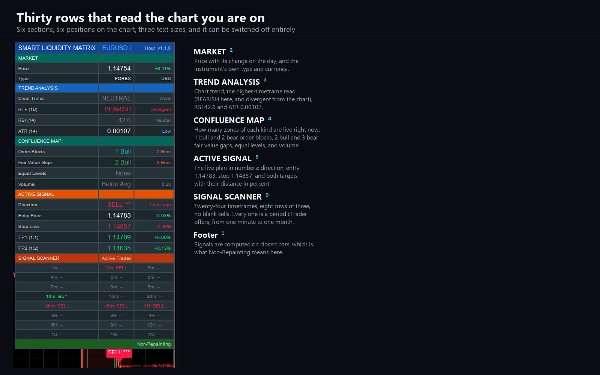
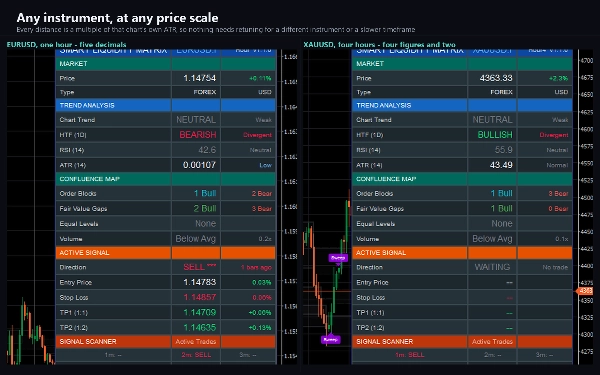
Trzydzieści wierszy w sześciu sekcjach: rynek, analiza trendu, mapa konfluencji, aktywny sygnał,

skaner i stopka. Sześć pozycji, trzy rozmiary tekstu, i można go całkowicie wyłączyć. Odstęp wierszy jest dostosowany do panelu wykresu cTrader, który jest zazwyczaj krótszy niż wykres w przeglądarce.


ALERTY I AUTOMATYZACJA


Log, dźwięk i alerty e-mailowe na sygnały, zdarzenia strukturalne i zlewy, z deduplikacją, więc jeden słupek generuje

jedną wiadomość. Wbudowany webhook wysyła te same zdarzenia jako JSON na dowolny wybrany adres, przez

własną usługę sieciową cTrader, więc bot lub dziennik mogą na nie reagować. Pozostaje wyłączony, dopóki nie wprowadzisz

adresu, nigdy nie uruchamia się podczas ładowania historii wskaźnika, nigdy nie działa w testach wstecznych i jest

ograniczony pod względem częstotliwości.


Wskaźnik nie wymaga podwyższonych uprawnień. Nie może czytać twoich plików ani uruchamiać procesów.


USTAWIENIA


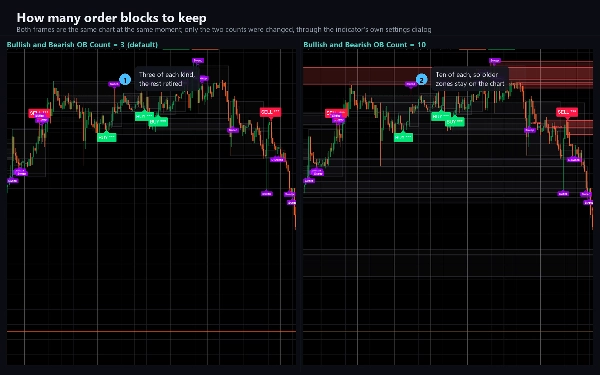
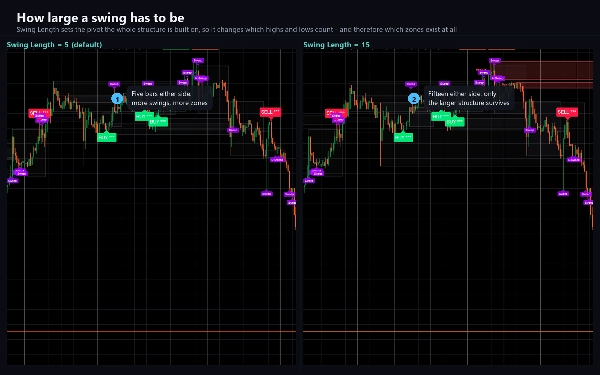
Siedemdziesiąt parametrów w szesnastu grupach. Każda liczba stref, kolor, ramy czasowe i pozycja etykiety są

regulowane, a tryb Lite odchudza każdą linię dla czytelniejszego wykresu.


ODPOWIEDNIE DLA


Forex, indeksy, metale i CFD na kryptowaluty. Dowolne ramy czasowe; domyślne ustawienia były na godzinę. Sekcja skanera jest najbardziej informatywna między pięcioma minutami a czterema godzinami.


CZEGO NIE ROBI


Nie składa, nie modyfikuje ani nie zamyka zleceń. Jest narzędziem analizy i powiadamiania. Sygnały są obliczane

tylko na zamkniętych słupkach i nie są przemalowywane.


Trading wiąże się z ryzykiem. Wyniki historyczne nie gwarantują przyszłych rezultatów.

Podsumowanie

Podsumowanie AI
Smart Liquidity Matrix is a market structure indicator designed for use on cTrader charts, supporting Forex, indices, metals, and crypto CFDs across all timeframes. It identifies and visually marks key institutional order flow features such as order blocks, fair value gaps, equal highs and lows, liquidity sweeps, and previous period levels. Order blocks highlight the last opposite candle before confirmed swings, while fair value gaps show three-bar imbalances. Equal highs and lows are connected to indicate liquidity pools targeted by sweeps, which are marked when price wicks beyond these levels but closes back inside. The indicator also displays buy and sell signals with entry, stop, and target levels based on trend-side EMA pullbacks.

A unique feature is its 24-timeframe signal scanner, which independently analyzes from one minute to monthly intervals, showing long, short, or neutral signals to identify multi-timeframe agreement. The dashboard organizes information into six sections including market data, trend analysis, confluence, active signals, and the scanner, optimized for cTrader’s chart pane.

Alerts can be configured for signals, structure events, and sweeps, with options for log, sound, email, and webhook notifications for automation or journaling. The indicator uses closed bars only and does not repaint. It offers extensive customization with seventy adjustable parameters and a Lite Mode for cleaner visuals. It does not execute trades but serves as an analytical and alerting tool.
Profil wskaźnika
Kategoria wskaźnika
Struktura rynku (SMC)
Typ wyjścia
Sygnały
Wymagania dotyczące danych
Tylko słupki
Obsługiwane sygnały
Przełamanie
Odwrócenie trendu
Dotknięcie poziomu
Przebicie poziomu

Dyskusja

Opinie klientów

4.2
Opinie: 5
5
20 %
4
80 %
3
0 %
2
0 %
1
0 %
Opinie klientów
October 23, 2026
the 24 timeframe scan brings entry and structure context into one convenient display. EMA pullbacks generate the arrows while blocks, gaps and sweeps are separate drawings, so a nearby zone does not automatically confirm the entry.
October 11, 2026
twenty four timeframe coverage gives the scanner a broad view beside blocks, FVGs and sweeps. Entries still come from a separate EMA pullback process. The extra context doesn't quietly turn every structural mark into part of the arrow's logic.
October 11, 2026
the arrows and boxes share a screen, but they don't do the same job. EMA pullbacks provide entries while blocks and gaps describe structure across the 24 timeframe view. Keeping that distinction clear makes the combined overlay more useful.
October 6, 2026
A block beside an arrow isn't automatically one setup. The overlay draws structural zones separately from its EMA pullback entries. Seeing both together is handy, as long as proximity isn't mistaken for a rule the tool never specified.
October 4, 2026
Tested on EURUSD H1 and XAUUSD H1/M1. Order Blocks, FVG zones, liquidity sweep markers and BUY/SELL labels rendered correctly. The dashboard provided clear market context, and the 24-timeframe scanner showed consistent states across XAUUSD charts. WAITING displayed correctly without active trade levels. Main UX issues are overlapping Sweep labels and the large dashboard footprint.

Częste pytania

Premium/Discount
Fair Value Gap
Key Levels
Liquidity Sweep
Order Block
Market Structure
Liquidity Grab
Produkty dostępne za pośrednictwem cTrader Store, w tym boty handlowe, wskaźniki i wtyczki, dostarczane są przez deweloperów zewnętrznych i udostępniane wyłącznie w celach informacyjnych oraz w celu zapewnienia dostępu technicznego. cTrader Store nie jest brokerem i nie zapewnia doradztwa inwestycyjnego, nie udziela spersonalizowanych rekomendacji ani nie gwarantuje przyszłych wyników.

Więcej od tego autora

Wskaźnik
ATR
CCI
+4
A trend line that never steps back, a shaded band to the price, and a pointer at the swing where the trend turns.
cBot
Balanced
Fixed Lot
+5
Gold grid cBot for XAUUSD H1: four-signal confluence on closed bars, ladders closed at a basket profit, news filter
15.6%
ROI
2.33
Współczynnik zysku
Wskaźnik
ATR
EMA
+3
EMA cross filtered by a trend average and its ATR channel, with long, short and close marks and colored candles.
Wskaźnik
ATR
RSI
+4
Adaptive Ichimoku with nine-factor confluence scoring, five signal types, smart TP/SL and an MTF panel.
Wskaźnik
ATR
RSI
+5
Fusion trend line with a layered cloud, BULL and BEAR labels, scored re-entry triangles and exit markers.
Wskaźnik
ATR
RSI
+4
RSI bands drawn on price, confluence-scored BUY/SELL signals, an ATR stop with three targets
Wskaźnik
ADX
ATR
+5
EMA-cross signals scored on six confluence layers, with an ATR stop, three targets and a live panel
Wskaźnik
ATR
EMA
+4
Range-filter BUY/SELL signals scored by four confluence layers, with a stop, five targets and a trend panel
Wskaźnik
ADX
ATR
+5
SuperTrend signals scored on five confluence factors, with an ATR stop, three targets and a dashboard.
Logo „QuotientDrift”
Statystyki na żywo
5.0
(1)
$97
/
$147
cBot
TP Manager
Break Even
+5
Gold cBot for prop-firm accounts: pick your firm, phase and size; risk is sized from the firm's rules, its limits kept
1.6
Współczynnik zysku
Wskaźnik
ATR
Volume
+3
Fibonacci trend signals on closed bars, with an ATR stop, up to four targets and a break-even ladder.
Wskaźnik
ATR
EMA
+2
Eight-EMA ribbon with ATR trade zones, a nine-symbol screener and a five-timeframe trend dashboard.

Możesz także polubić

Wskaźnik
ATR
RSI
+19
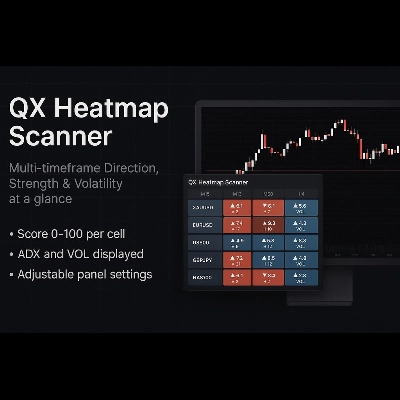
Multi-timeframe heatmap scoring Direction, Strength & Volatility at a glance!
Wskaźnik
AI
ATR
+20
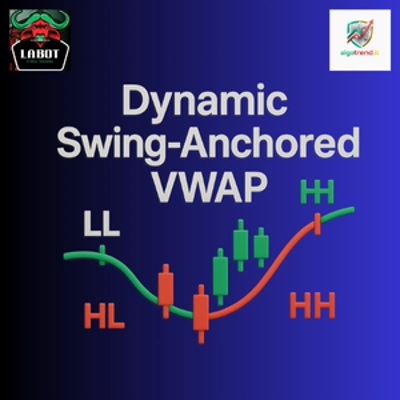
“Dynamic Swing VWAP — Structure-Anchored, Volatility-Adaptive, Market-Ready.” 🚀
Wskaźnik
ATR
MSS
+5
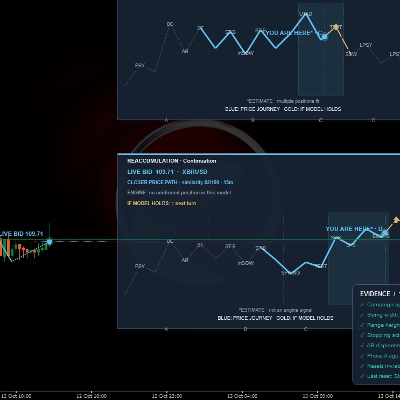
Advanced market structure and institutional cycle mapper with visual reference cards and entry alerts
Wskaźnik
Master RSI reversals with Parabolic SAR precision! Get real-time alerts for high-probability trend changes.
Wskaźnik
Forex
BTCUSD
+10
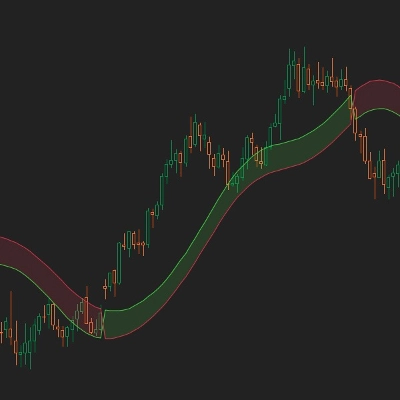
Trend-following channel using dual MAs with visual cloud and optional alerts on crossovers
Wskaźnik
RSI
Fibonacci
+1
Spot RSI divergences on your chart and get an entry, stop and six targets when your filters line up.
Wskaźnik
AI
RSI
+7
Multi-asset screener with real-time RSI/volatility analysis, interactive dashboard, and color-coded trading signals.
Logo „E7 BBKG Indicator”
Najwyżej oceniane
4.5
(4)
$25
/
$50
Wskaźnik
Prop
E7 BBKG indicator with 80% plus accuracy used to show both, possible reversal and trend.
Wskaźnik
AI
Grid
+9
Pivot Point MultiTimeFrame with Order Block
Wskaźnik
ATR
BOS
+5
Opening ranges, dynamic trend channels, and multi-scale breakout/retest analysis for clear intraday chart decisions.
Wskaźnik
SMC
Forex
+5
The only cTrader FVG indicator with Breakaway Gap detection, mitigation tracking, and full multi-asset compatibility.
Wskaźnik
VWAP
Support & Resistance
Trading.FC$_vwap Algo shows VWAP trends, dynamic support/resistance and deviation bands to spot potential trade entries.
Wskaźnik
RSI
Forex
+12
Indicator pattern signal moment
Wskaźnik
The Advanced Volume Profile Indicator calculates POC, Median, and Mode, revealing key price levels for smarter trading.
Wskaźnik
Signal
Breakout
+1
Bolliger Bands + Hamster-Coder™ Timeframe Decoupling
Wskaźnik
Forex
EURUSD
+5
With this Fibonacci retracement indicator, traders have full control over the retracement levels displayed on the chart.
Wskaźnik
Supertrend
Moving Average
Easy Trade: Trend & Breakout Indicator for cTrader
Wskaźnik
Forex
EURUSD
+7
Institutional Session Levels Pro OHLC,Prev(D,W,M OHLC)

Cena

16
Sprzedaż
333
Bezpłatne instalacje