
Penerangan
Penunjuk Zon Donchian Lanjutan untuk cTrader
Kuasa Tren Pasaran & Pecahan dengan Ketepatan!
Bawa dagangan anda ke tahap seterusnya dengan Penunjuk Zon Donchian Lanjutan – alat yang kuat direka untuk pedagang yang menuntut ketepatan, fleksibiliti, dan kecekapan. Penunjuk generasi seterusnya ini meningkatkan Saluran Donchian klasik dengan memperkenalkan analisis pelbagai jangka masa, pengiraan harga yang boleh disesuaikan, amaran masa nyata, dan visualisasi awan.
Sama ada anda berdagang forex, saham, atau komoditi, Penunjuk Zon Donchian Lanjutan membekalkan anda dengan alat untuk mengenal pasti pecahan, menunggang tren, dan berdagang pembalikan seperti seorang profesional.
Ciri-ciri & Manfaat Utama:
1. Zon Donchian Pelbagai Jangka Masa
- Analisis Zon Donchian dari jangka masa yang lebih tinggi semasa berdagang pada jangka masa yang lebih rendah, memastikan anda sentiasa selaras dengan tren pasaran yang lebih besar.
- Sesuai untuk pedagang harian dan pedagang ayunan yang ingin mengoptimumkan kemasukan dan keluar mereka.
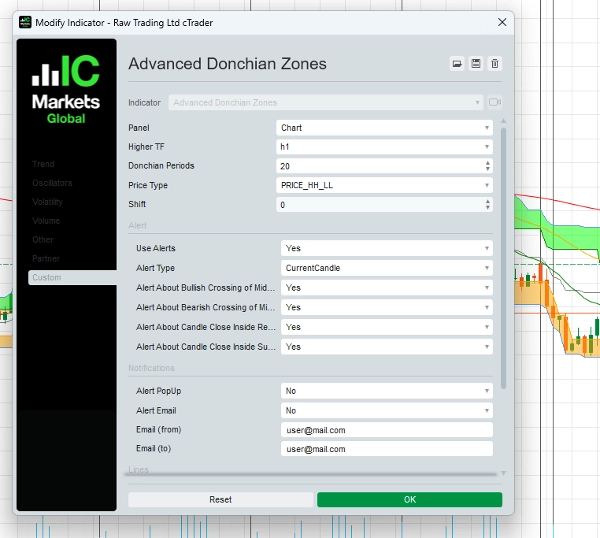
2. Pengiraan Harga Boleh Disesuaikan
- Pilih dari lima jenis harga lanjutan untuk memperhalusi strategi anda:
-
- Tinggi Tertinggi / Rendah Terendah
- Purata Tinggi/Buka atau Tinggi/Tutup
- Buka Tertinggi / Buka Terendah
- Tutup Tertinggi / Tutup Terendah
- Sesuaikan penunjuk untuk menepati gaya dagangan dan pengurusan risiko anda.
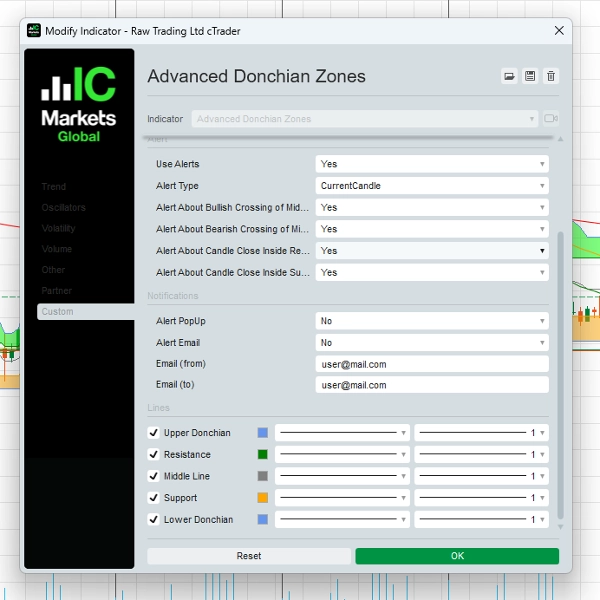
3. Amaran Dinamik – Jangan Lepaskan Peluang!
- Dapatkan notifikasi masa nyata apabila peristiwa dagangan utama berlaku:
-
- Persilangan Garis Tengah (Isyarat Bullish atau Bearish)
- Harga Menutup Dalam Zon Utama (Zon pembalikan atau pecahan berpotensi)
- Amaran tersedia melalui pop-up dan emel, memastikan anda sentiasa mendahului pergerakan pasaran.
4. Visualisasi Awan untuk Wawasan Jelas
- Zon berbayang unik antara tahap Donchian membantu pedagang mengenal pasti secara visual sokongan, rintangan, dan kawasan pecahan dengan cepat dan berkesan.
5. Parameter Peralihan Fleksibel
- Laraskan kedudukan Zon Donchian ke hadapan atau ke belakang dalam masa untuk memperhalusi strategi dagangan anda.
6. Antara Muka Mudah Digunakan
- Direka untuk pedagang dari semua peringkat, dengan susun atur intuitif dan tetapan yang boleh disesuaikan mengikut keutamaan dagangan anda.
Cara Menggunakan Penunjuk Zon Donchian Lanjutan
1. Strategi Dagangan Pecahan – Tangkap Pergerakan Meletup!
- Persediaan:
-
- Gunakan Penunjuk Zon Donchian Lanjutan pada carta anda.
- Pilih tempoh Donchian (contoh, 20) dan jangka masa lebih tinggi (contoh, 1H atau 4H) untuk isyarat yang lebih tepat.
- Masuk:
-
- Beli apabila harga memecah dan menutup di atas Zon Donchian atas.
- Jual apabila harga memecah dan menutup di bawah Zon Donchian bawah.
- Keluar:
-
- Gunakan garis tengah atau Zon Donchian bertentangan sebagai tahap keluar anda.
- Contoh:
-
- Jika berdagang pada carta 15 minit, tetapkan pengiraan Donchian berdasarkan jangka masa 1 jam. Apabila harga memecah di atas tahap Donchian atas, masuk dagangan beli dengan stop-loss berhampiran garis tengah.
2. Strategi Mengikuti Tren – Ikuti Momentum Pasaran
- Persediaan:
-
- Gunakan garis tengah sebagai penapis tren.
- Berdagang hanya mengikut arah tren yang sedang berlaku.
- Masuk:
-
- Beli apabila harga di atas garis tengah dan memantul dari zon sokongan.
- Jual apabila harga di bawah garis tengah dan memantul dari zon rintangan.
- Keluar:
-
- Tutup dagangan apabila harga melintasi garis tengah ke arah bertentangan.
- Contoh:
-
- Pada carta 4 jam, harga kekal di atas garis tengah, mengesahkan tren menaik. Masuk dagangan beli apabila harga retrace ke zon sokongan dan menunjukkan tanda-tanda pembalikan.
3. Strategi Dagangan Terhad Julat – Keuntungan dalam Pasaran Mendatar
- Persediaan:
-
- Kenal pasti tempoh apabila harga berayun antara Zon Donchian atas dan bawah.
- Masuk:
-
- Beli apabila harga menghampiri sokongan.
- Jual apabila harga menghampiri rintangan.
- Keluar:
-
- Ambil keuntungan berhampiran Zon Donchian bertentangan atau apabila berlaku pecahan.
- Contoh:
-
- Pada carta 1 jam, jika harga berayun antara tahap Donchian atas dan bawah, laksanakan dagangan pada ekstrem ini untuk peluang pembalikan purata.
Mengapa Pedagang Memilih Zon Donchian Lanjutan
✔ Serbaguna untuk Gaya Dagangan Berbeza – Berfungsi untuk pecahan, mengikuti tren, dan dagangan julat.
✔ Meningkatkan Ketepatan Dagangan – Kenal pasti tahap sokongan & rintangan utama dengan tepat.
✔ Amaran Masa Nyata – Sentiasa maklum dengan notifikasi segera.
✔ Alat Gred Profesional – Dibangunkan untuk pedagang yang mencari kelebihan dalam pasaran.
Harga & Tawaran Eksklusif
Harga Terhad Masa Istimewa: $97 (Bayaran Sekali)
Termasuk:
- Penunjuk Zon Donchian Lanjutan untuk cTrader
- Panduan Pengguna Komprehensif dengan strategi langkah demi langkah
- Kemas Kini Percuma selama 1 Tahun
- Sokongan Emel Keutamaan
Apa Kata Pedagang
“Saya telah menggunakan Saluran Donchian selama bertahun-tahun, tetapi penunjuk ini membawa ke tahap lain. Ciri pelbagai jangka masa adalah pengubah permainan!”
— Mark S., Pedagang Forex
“Amaran dan tetapan harga yang boleh disesuaikan membantu saya menangkap dagangan pecahan dengan lebih yakin. Sangat disyorkan untuk pedagang serius.”
— Lisa T., Pedagang Ayunan
Mulakan Hari Ini!
Bersedia untuk mengubah dagangan anda? Klik butang di bawah untuk membeli Penunjuk Zon Donchian Lanjutan dan mula berdagang dengan ketepatan!
[Beli Sekarang dengan $97]
Jaminan Wang Dikembalikan 30 Hari
Kami berdiri di belakang produk kami. Jika anda tidak berpuas hati sepenuhnya, hubungi kami dalam 30 hari untuk pulangan penuh – tiada soalan ditanya.
Perlukan Bantuan? Hubungi Kami!
📧 Emel: o.elmottaqy@gmail.com
🌐 Laman Web: https://t.me/mottaqyo
Penafian Risiko
Dagangan melibatkan risiko. Penunjuk Zon Donchian Lanjutan adalah alat untuk membantu keputusan dagangan anda tetapi tidak menjamin keuntungan. Sentiasa gunakan pengurusan risiko yang betul dan berdagang dengan bertanggungjawab.
Ringkasan
Key functionalities include real-time alerts via pop-ups and email for significant events such as midline crossovers and price closing inside key zones, helping traders stay informed of potential breakouts or reversals. A unique cloud visualization feature shades zones between Donchian levels to clearly identify support, resistance, and breakout areas. The flexible shift parameter allows users to adjust the positioning of Donchian Zones forward or backward in time for strategy fine-tuning.
Suitable for forex, stocks, and commodities markets, this indicator supports multiple trading strategies including breakout, trend-following, and range-bound trading. It features an intuitive interface designed for traders of all levels. The product includes a comprehensive user guide with step-by-step strategies, free updates for one year, and priority email support.
Ulasan pelanggan
5 | 50 % | |
4 | 50 % | |
3 | 0 % | |
2 | 0 % | |
1 | 0 % |


