📊 带多时间框架和动态偏差带的VWAP
释放机构级价格水平的真正力量。
这个高级VWAP(成交量加权平均价)指标具有:
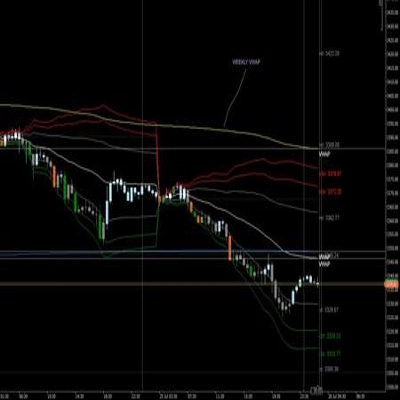
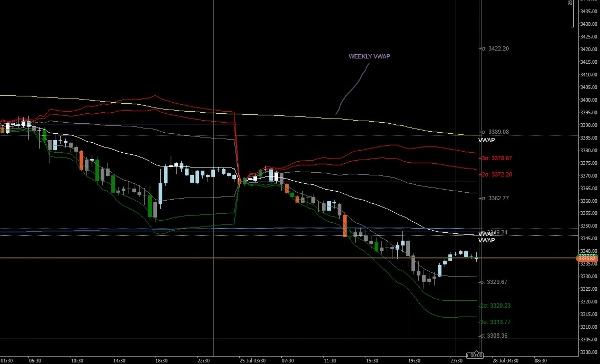
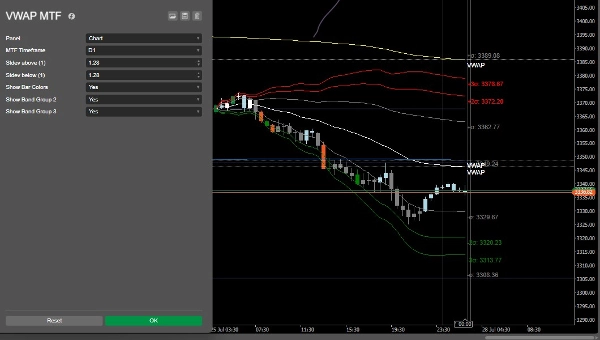
✅ 多时间框架VWAP – 选择任何更高时间框架(HTF),如H1、H4、D1,在当前图表上绘制VWAP,实现自上而下的共识。
✅ 标准偏差带(1σ,2σ,3σ) – 使用动态偏差带精准识别超买/超卖区域。
✅ 实时标注 – 仅在当前蜡烛上清晰标记VWAP和偏差水平,保持图表整洁且信息丰富。
我的其他产品
- Institutional FVG Zones MTF with Confluence
- All-in-One Session Levels Suite
- MARKET_STRUCTURE BOS_CHoCH
- Multi_TF Candlestick Chart Overlay
- ICT Killzones & Macros
- ICT_SMC_ToolKit
- VWAP_MTF
- Traders Dynamic Index (TDI)
- Market_Session_Forex
免责声明: 交易存在风险,过去的结果不保证未来的表现。请使用适当的风险管理,遵守止损水平,负责任地交易。我不对使用这些算法造成的任何财务损失负责。使用这些指标来辅助你的共识,减少图表标注时间的负担。
指标配置
4.5
评价:2
5 | 50 % | |
4 | 50 % | |
3 | 0 % | |
2 | 0 % | |
1 | 0 % |
客户评价
August 1, 2025
It helped mostly by making bad ideas easier to skip, and it only covers one part of the decision.
July 27, 2025
Most of the value comes from pressure is easier to read, and a few ugly trades are useful in the sample.
BTCUSD
Forex
Signal
Breakout
Indices
EURUSD
Commodities
GBPUSD
NZDUSD
Prop
Scalping
SMC
Crypto
Stocks
XAUUSD
NAS100
USDJPY
VWAP
cTrader Store 提供的所有产品,包括交易机器人、指标和插件,均由第三方开发者提供,仅供信息参考和技术访问之用。cTrader Store 并非经纪商,不提供投资建议、个人推荐或任何未来业绩保证。
该作者的其他作品


注册日期 22/06/2025
69
销售
63
免费安装