
DEnvelopSystem
Wskaźnik
Wersja 1.0, Aug 2025
Windows, Mac
5.0
Opinie: 1
Opis
📈 DEnvelopSystem — Precyzyjna koperta na dwóch ramach czasowych
DEnvelopSystem to wysokowydajny wskaźnik handlowy stworzony dla skalperów i strategów intraday, którzy wymagają precyzji, elastyczności i konfluencji. Zaprojektowany do płynnej pracy na ramach czasowych 1–5 minut, to narzędzie łączy dwie koperty średnich kroczących z dwóch różnych ram czasowych, oferując dynamiczne ramy zarówno dla strategii podążania za trendem, jak i strategii powrotu do średniej.
🔧 Kluczowe cechy
- Fuzja kopert na dwóch ramach czasowych
Nakłada koperty z dwóch ram czasowych, aby uchwycić krótkoterminową zmienność w szerszych ruchach strukturalnych. Idealne do identyfikacji mikro-korekt w makrotrendach. - Dostosowywany procentowy odchył cenowy
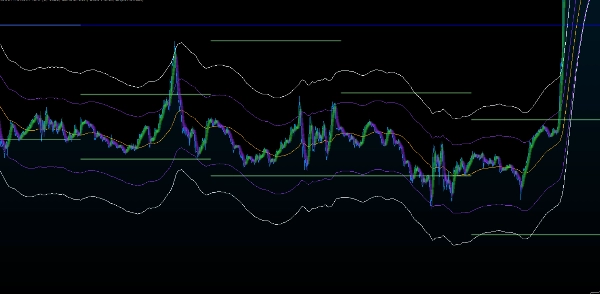
Precyzyjnie reguluj czułość koperty za pomocą regulowanych progów procentowych, pozwalając traderom definiować własne pasma zmienności i strefy wybicia. - Wizualizacja pięcioliniowa
Wyświetla łącznie pięć linii: dwie górne granice, dwie dolne granice oraz centralną średnią kroczącą — tworząc wyraźną wizualną mapę zachowania ceny i stref kompresji. - Kolorowe strefy konfluencji
Niestandardowe kolorowanie podkreśla kluczowe obszary nakładania się i rozbieżności, czyniąc strefy wejścia o wysokim prawdopodobieństwie natychmiast rozpoznawalnymi. - Synergia trendu i powrotu
Niezależnie od tego, czy podążasz za momentum, czy wygaszasz ekstremy, DEnvelopSystem dostosowuje się do twojej strategii — oferując wiarygodne sygnały zarówno dla setupów wybicia, jak i odbicia
🎯 Dlaczego traderzy go kochają
- Podstawowe narzędzie konfluencji: Działa jako wizualny kotwica dla zestawów wielowskaźnikowych, pomagając precyzyjnie potwierdzać wejścia.
- Optymalizacja pod skalping: Stworzony do szybkiego tempa, gdzie czas i klarowność są wszystkim.
- Mistrzostwo wejścia: Wskazuje strefy, gdzie cena wchodzi w interakcję z granicami kopert na różnych ramach czasowych — idealne dla wejść w stylu snajperskim i precyzyjnego ustawiania stopów.
Podsumowanie
Profil wskaźnika
Opinie klientów
5.0
Opinie: 1
5 | 100 % | |
4 | 0 % | |
3 | 0 % | |
2 | 0 % | |
1 | 0 % |
Dyskusja
Częste pytania
Produkty dostępne za pośrednictwem cTrader Store, w tym boty handlowe, wskaźniki i wtyczki, dostarczane są przez deweloperów zewnętrznych i udostępniane wyłącznie w celach informacyjnych oraz w celu zapewnienia dostępu technicznego. cTrader Store nie jest brokerem i nie zapewnia doradztwa inwestycyjnego, nie udziela spersonalizowanych rekomendacji ani nie gwarantuje przyszłych wyników.


Cena
25
Sprzedaż
2.1K
Bezpłatne instalacje