
Descrizione
🔷 Trend Lines Premium Engine
Indicatore Multi-Layer Market Structure & Dynamic Regression
https://chartshots.spotware.com/c/69d3c949a2e08
📌 Cos'è?
Trend Lines Premium Engine è un indicatore sovrapposto che combina 5 moduli indipendenti in un unico strumento. Ogni modulo può essere attivato o disattivato. Mappa la struttura di mercato, i canali dinamici e le zone di regressione basate sul volume direttamente sul grafico dei prezzi.
Risponde a tre domande fondamentali:
- Dove si trova il prezzo all'interno della struttura attuale?
- Qual è il trend dominante e dove sono i punti di rottura?
- A quali livelli di prezzo è concentrata l'attività?
🧩 I 5 Moduli
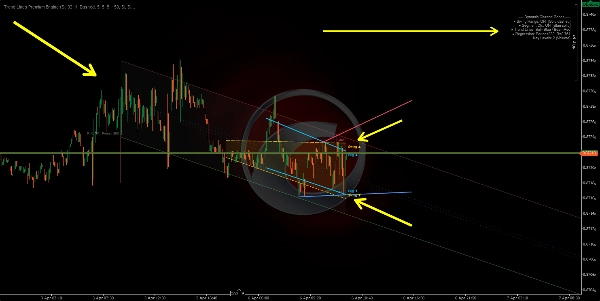
1️⃣ Swing Range Connector
https://chartshots.spotware.com/c/69d3cab9b805b
Rileva i massimi e minimi swing più recenti, quindi disegna un canale inclinato che collega il più vecchio al più nuovo su entrambi i lati. L'area tra i due è riempita come zona di intervallo dinamico.
Come funziona:
- Una barra è qualificata come punto swing quando il suo massimo (o minimo) è il più estremo rispetto a N barre prima e N barre dopo.
- Una linea retta è tracciata dal swing più vecchio a quello più recente, creando confini superiori e inferiori.
- Il canale si sposta automaticamente ogni volta che un nuovo punto swing è confermato.
Come leggerlo:
- Prezzo all'interno del canale → intervallo strutturale definito.
- Rottura sopra/sotto → espansione della volatilità o cambiamento di struttura.
- Inclinazione del canale → direzione predominante dell'intervallo.
Parametro
Scopo
Barre Prima / Dopo Swing
Barre richieste su ciascun lato per confermare uno swing. Maggiore = swing più significativi
Max Punti Swing
Quanti swing memorizzare. Controlla la profondità del canale
Finestra Storica
Quanto indietro viene disegnato il canale
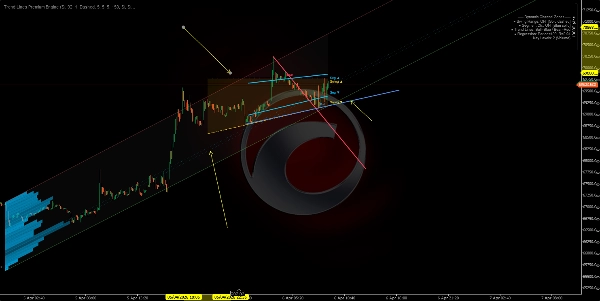
2️⃣ Segment Linear Channel
https://chartshots.spotware.com/c/69d3cb221bba1
Divide la finestra di analisi in 5 segmenti uguali, trova il massimo più alto e il minimo più basso in ciascuno, quindi adatta una linea di regressione ai minimi quadrati attraverso quei 5 punti superiori e un'altra attraverso i 5 punti inferiori.
Come funziona:
- La finestra è divisa in 5 parti. Viene estratto un estremo rappresentativo per parte.
- La regressione lineare è applicata su quei 5 punti per ciascun confine.
- Il risultato è un canale che si adatta alla struttura di prezzo segmentata piuttosto che solo a due punti finali.
Come leggerlo:
- Canale ascendente → trend strutturale rialzista.
- Canale discendente → trend strutturale ribassista.
- Ripetuti tocchi su un confine → supporto/resistenza dinamici.
Differenza dal Modulo 1: Swing Range collega solo il primo e l'ultimo swing. Segment Channel usa una regressione a 5 punti, rendendolo più fluido e meno reattivo a un singolo swing.
3️⃣ Swing Point Labels
Rileva massimi e minimi swing e li classifica in 4 categorie di struttura di mercato:
Etichetta
Significato
Indica
HL
Minimo più alto
Struttura rialzista
HH
Massimo più alto
Struttura rialzista
LH
Massimo più basso
Struttura ribassista
LL
Minimo più basso
Struttura ribassista
Come funziona:
- Ogni nuovo minimo swing è confrontato con il minimo swing precedente. Più alto → HL. Più basso → LL.
- Ogni nuovo massimo swing è confrontato con il massimo swing precedente. Più alto → HH. Più basso → LH.
Come leggerlo:
- Sequenza HL + HH → trend rialzista intatto.
- Sequenza LH + LL → trend ribassista intatto.
- Un HL che rompe in LL, o un LH che rompe in HH → cambio di struttura (BOS/CHoCH).
Di default sono mostrati solo HL e LH per mantenere il grafico pulito. HH e LL possono essere abilitati per una visibilità completa della struttura.
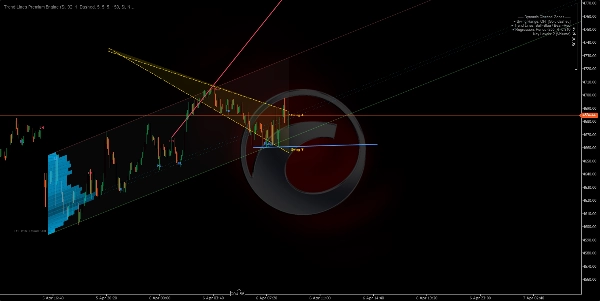
4️⃣ Automatic Trend Lines
https://chartshots.spotware.com/c/69d3cc071272e
Disegna linee di tendenza collegando i due minimi swing più recenti (linea rialzista) e i due massimi swing più recenti (linea ribassista). La linea attiva è prominente; le linee precedenti si dissolvono.
Come funziona:
- Nuovo minimo swing rilevato → linea tracciata dal minimo swing precedente a quello nuovo (linea di tendenza rialzista).
- Nuovo massimo swing rilevato → linea tracciata dal massimo swing precedente a quello nuovo (linea di tendenza ribassista).
- La linea si proietta in avanti per un numero configurabile di barre.
- Quando viene creata una nuova linea, quella precedente svanisce in un colore semi-trasparente.
Segnali di breakout (opzionali): Quando abilitati, l'indicatore rileva se il prezzo di chiusura attraversa una linea di tendenza attiva:
- 🔼 Freccia verso l'alto → breakout rialzista.
- 🔽 Freccia verso il basso → breakout ribassista.
Parametro
Scopo
Max Coppie di Linee
Quante coppie di linee mantenere visibili. Impostare a 1 per la vista più pulita
Max Barre di Estensione
Quanto la linea si proietta in avanti. Impedisce alle linee di attraversare l'intero grafico
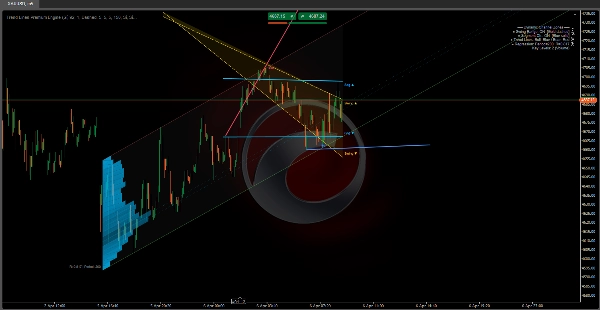
5️⃣ Dynamic Regression Zone
Il modulo più avanzato. Calcola un canale di regressione lineare sui prezzi di chiusura e sovrappone un profilo di attività (istogramma) che mostra dove il volume o i tocchi sono concentrati all'interno del canale. Segna anche livelli chiave nelle zone di massima attività.
A) Canale di Regressione:
- La regressione lineare ai minimi quadrati è applicata ai prezzi di chiusura su un periodo dato.
- Viene calcolata la deviazione standard dei prezzi dalla linea di regressione.
- Le bande superiore e inferiore sono posizionate a N deviazioni standard dal centro (default: 2.0).
- Opzionalmente calcolato in scala logaritmica per una migliore precisione su strumenti ad alto prezzo o alta volatilità.
B) Rilevamento Periodo Automatico:
- L'algoritmo testa più periodi (da 50 a 400 barre) e calcola il coefficiente di correlazione di Pearson per ciascuno.
- Seleziona il periodo con la correlazione più alta — dove la regressione lineare si adatta meglio al movimento del prezzo.
- Il valore di correlazione è mostrato sul grafico (es., R = 0.85).
C) Istogramma di Attività:
- Il canale è diviso in sezioni orizzontali (fino a 25).
- Per ogni sezione, l'algoritmo conta quante barre hanno toccato quel livello di prezzo, ponderato per volume o numero di tocchi (configurabile).
- Le sezioni con maggiore attività appaiono come barre più lunghe e più opache.
- Questo rivela il Punto di Controllo (POC) e le zone di alta/bassa attività all'interno del canale.
D) Livelli Chiave:
- Le sezioni con la maggiore attività sono proiettate in avanti come linee orizzontali.
- Funzionano come supporti e resistenze basati sul volume nel contesto della regressione.
Come leggerlo:
- Prezzo vicino alla banda superiore → zona statisticamente ipercomprata.
- Prezzo vicino alla banda inferiore → zona statisticamente ipervenduta.
- R vicino a 1 o -1 → trend lineare forte e affidabile. R vicino a 0 → intervallo o regressione non significativa.
- I livelli chiave agiscono come calamite per il prezzo — le zone con concentrazione storica di attività tendono ad attrarre il prezzo di nuovo.
🎯 Casi d'Uso
Caso d'Uso
Moduli
Identificare la struttura di mercato (rialzista/ribassista/intervallo)
Swing Labels + Trend Lines
Rilevare supporti e resistenze dinamici
Swing Range + Segment Channel
Trovare zone di valore tramite il volume
Regression Zone + Key Levels
Confermare rotture di struttura
Trend Lines + Breakout Signals
Misurare la forza del trend
Correlazione di Pearson (Regression Zone)
⚙️ Setup Consigliato per Stile
Stile
Moduli Suggeriti
Scalping (M1–M15)
Swing Labels + Trend Lines
Intraday (M15–H1)
Tutti i moduli
Swing Trading (H4–D1)
Swing Range + Regression Zone + Key Levels
Analisi pura della struttura
Solo Swing Labels + Trend Lines
⚠️ Note Importanti
Riepilogo
The five modules include:
1. Swing Range Connector: Detects recent swing highs and lows to draw a sloped channel representing the structural range.
2. Segment Linear Channel: Divides the analysis window into five segments, fitting regression lines through highs and lows for a smoother channel.
3. Swing Point Labels: Classifies swing highs and lows into four market structure categories (Higher High, Higher Low, Lower High, Lower Low) to indicate bullish or bearish trends and structure shifts.
4. Automatic Trend Lines: Connects the two most recent swing highs and lows with trend lines, highlighting active lines and optionally signaling breakouts.
5. Dynamic Regression Zone: Calculates a linear regression channel on closing prices with an activity histogram showing volume or touch concentration, marking key volume-based support and resistance levels.
The indicator supports various trading styles, recommending specific module combinations for scalping, intraday, swing trading, and pure structure analysis. It requires price bars and volume data and provides visualizations and signals including breakout, trend strength, and level touches or breaks.


