present
Zarejestruj się i otrzymaj 50 $ zniżki na pierwszy zakup
Trading product for DayContextPro Wskaźnik Key Levels Support & Resistance, image 1
DayContextPro
Wskaźnik
1 pobrania
Wersja 1.1, Oct 2026
Windows, Mac
Trading product for DayContextPro Wskaźnik Key Levels Support & Resistance, image 2
Trading product for DayContextPro Wskaźnik Key Levels Support & Resistance, image 3
Od 09/03/2026
48
Bezpłatne instalacje

Opis

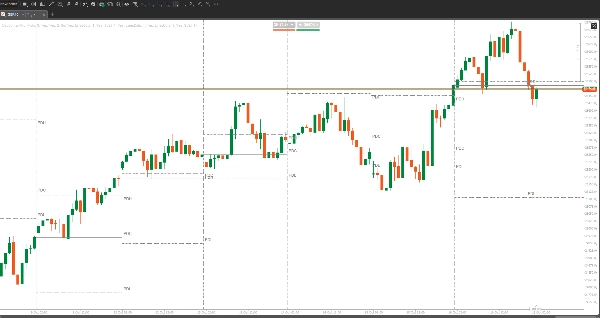
DayContextPro gives intraday charts a clean daily structure. It marks where each trading day and week begins, and carries the previous day’s high, low and close into the next day. These lines are drawn for every day in the chart’s history, not just today, so you can scroll back and see how price reacted to these levels day after day.

Indicator type: Price action and support/resistance (chart overlay)
Preferred instruments: FX pairs, gold, indices and any symbol with a daily session
Preferred periods: M1 to H1. The indicator draws nothing on H2 and above.
Platform: cTrader Windows and Mac (desktop only)

Trading use cases

  • Seeing where each day and week starts at a glance
  • Watching how price reacts at the previous day’s high, low and close
  • Reviewing past days to study breakouts, sweeps and rejections at these levels
  • Planning targets and stops around the previous day’s range

What it draws

  • Day separator: a lines-dots vertical line at the start of each trading day
  • Week separator: a solid vertical line at each week boundary
  • Previous day high and low (PDH/PDL): lines-dots lines across the following day
  • Previous day close (PDC): a solid line across the following day

Each day’s levels span that day only, so past days stay easy to read. Today’s levels run to the right edge of the chart. PDH, PDL and PDC labels show for today, with an option to label past days too.

Accurate trading days
Days follow your broker’s own daily candles, so the lines match its D1 chart. On brokers with a short Sunday candle, that candle counts as part of Monday, so Friday’s levels carry into Monday as they should.

Colors that fit your chart
In Auto mode, lines are grey on a light chart and white on a dark chart. They update straight away if you switch theme. In Custom mode, every line type has its own color.

Settings

  • Show or hide each line type
  • Colour, line style and thickness for each line type
  • Number of past days to draw (all by default)
  • Label options

Notes

  • The indicator does not place trades or predict price.
  • Previous day levels are reference points, not signals. Always use proper risk management.

Trading involves risk. Past performance does not guarantee future results.

Podsumowanie

AI summary
DayContextPro is a chart overlay indicator designed for cTrader desktop (Windows and Mac) that enhances intraday price action analysis on M1 to H1 timeframes. It visually structures intraday charts by marking the start of each trading day and week with vertical separator lines. The indicator also plots the previous day’s high, low, and close levels as horizontal lines extending across the following day, allowing traders to observe how price interacts with these key reference points over time.

Key features include:
- Day separators (lines-dots vertical lines) and week separators (solid vertical lines).
- Previous day high and low (PDH/PDL) shown as lines-dots lines.
- Previous day close (PDC) shown as a solid horizontal line.
- Levels are drawn for every day in the chart history, not just the current day.
- Labels for today’s PDH, PDL, and PDC with optional labels for past days.
- Automatic color adaptation to chart theme or customizable colors and line styles.
- Settings to show/hide line types, adjust colors, line thickness, and number of past days displayed.

The indicator uses the broker’s daily candle definitions to ensure accurate daily boundaries. It supports FX pairs, gold, indices, and any symbol with a daily session. DayContextPro does not generate trade signals or place trades; it provides visual reference levels to assist with planning targets, stops, and studying price behavior around previous day ranges.

Profil wskaźnika

Opinie klientów

0.0
Opinie: 0
Opinie klientów
Ten produkt nie ma jeszcze opinii. Wypróbowałeś(-aś) go już? Bądź pierwszy(-a) i powiedz o tym innym!

Dyskusja

Częste pytania

Key Levels
Support & Resistance
Produkty dostępne za pośrednictwem cTrader Store, w tym boty handlowe, wskaźniki i wtyczki, dostarczane są przez deweloperów zewnętrznych i udostępniane wyłącznie w celach informacyjnych oraz w celu zapewnienia dostępu technicznego. cTrader Store nie jest brokerem i nie zapewnia doradztwa inwestycyjnego, nie udziela spersonalizowanych rekomendacji ani nie gwarantuje przyszłych wyników.

Więcej od tego autora

Wskaźnik
Key Levels
Every major liquidity level drawn for you: PDH/PDL, PWH/PWL, PMH/PML and more. Same price on every timeframe. Free.
Wtyczka desktopowa
Prop Firm Fit
Trade Journal
+1
Paper trade your broker’s live prices in cTrader: demo accounts, prop challenges, a stats dashboard and trading journal
Wskaźnik
Fair Value Gap
Auto-draws every Fair Value Gap on any timeframe and removes it once filled. Clean, fast, free. Built for cTrader.
Wtyczka desktopowa
Trade Journal
Trade Statistics
Track. Analyze. Improve. A journal and statistics for your real cTrader trades, with a prop challenge guard.
Wskaźnik
EMA
Outlines the first candle of the real session open for indices, forex & crypto. Auto DST, HTF candle panel & EMA.
Wskaźnik
EMA
Flag
+2
Liquidity levels, trend lines, filtered chart patterns and a composite bias HUD in one cTrader overlay.
Wtyczka desktopowa
SL Manager
Risk/Reward
+5
Drag SL & TP on the chart, see risk, reward, R:R and lot size live, then place Buy or Sell orders in one click
Wskaźnik
BOS
CHOCH
+5
SMC structure indicator for cTrader: BOS/CHoCH, order blocks, FVGs, liquidity sweeps, key levels and alerts.
Wtyczka desktopowa
Chart UI Tools
Replay your broker’s charts candle by candle. Rewind any time, switch timeframes and practise trades with full stats.

Możesz także polubić

Wskaźnik
ATR
RSI
+11
This indicator puts three helpful trading tools on your chart at once. Think of it like having three expert traders
Wskaźnik
Prop
Forex
+5
Pivot Point with base zone daily Asia-London-New york Session.
Wskaźnik
BOS
Fibonacci
+4
Automatically draws major trading sessions, killzones, and SMC daily liquidity targets directly on your cTrader charts.
Wskaźnik
AI
ATR
+26
Session Volume Profile + Composite. POC/VAH/VAL, Focus/Solo. Fast, clean, no ghosts, live-ready.
Wskaźnik
AI
SMC
+7
The ultimate tool for Price Action and ICT. High, Low and Mid levels for days, weeks Inc. NY Midnight and Custom Range.
Wskaźnik
BOS
CHOCH
+4
Dual-track market structure detection with BVC order flow confirmation and two-stage liquidity sweep validation.
Wskaźnik
BOS
CHOCH
+5
MarketStructurePro – Smart BOS/CHoCH
Wskaźnik
BOS
MSS
+2
Stay ahead with a real-time countdown to candle closes on all key timeframes: 5m, 15m, 30m, 1H, 4H, and Daily.
Wskaźnik
AI
RSI
+18
Session boxes with UTC offset, OR logic, adjustable opacity, and multi-day lookback.
Wskaźnik
Doji
Volume
+5
Instantly spot high-liquidity institutional moves with clean, non-obtrusive triangle alerts on cTrader charts.
Logo „Dem”
Najwyżej oceniane
4.2
(4)
$20
Wskaźnik
Forex
BTCUSD
+5
Scalping indicator for Renko 100 using EMAs to show trend and entry zones with clear colored rectangles.
Wskaźnik
Drawdown Monitor
Protect your funded account. Real-time Daily Equity Drawdown monitor with Green / Orange / Red flashing alerts.
Wskaźnik
Signal
"Buy Sell Prize: The indicator that reveals market secrets. Precise signals to buy, sell, and profit. Your ultimate trad
Wskaźnik
ATR
Wedge
+2
Strong Supertrend Turn Market Movement into a Clear Map Market analysis
Wskaźnik
SMC
Prop
+9
PDL/PDH/PWL/PWH and Session higs/lows (customizable)
Wskaźnik
SMC
Prop
+5
ADVANCED ICT + ADR + AWR SUITE PRO (The Ultimate All-in-One Toolkit for Price Action Traders)
Wskaźnik
Risk Dashboard
AI-powered daily range forecasts help traders spot volatility opportunities and plan stops and targets.
Wskaźnik
MACD
Dynamic MACD histogram dots with smart crossing signals for faster momentum analysis.

Cena

Od 09/03/2026
48
Bezpłatne instalacje