
TradingView-Style Indicators for cTrader
Browse a list of TV-inspired indicators recreated for cTrader, including tools based on popular Super Trend logic and other well-known chart concepts. Find free and paid chart tools that replicate familiar visual workflows and support different trading strategy styles without leaving the platform. Useful for traders migrating from TV or rebuilding proven setups inside cTrader.
Tools
Tool comparison
FAQ



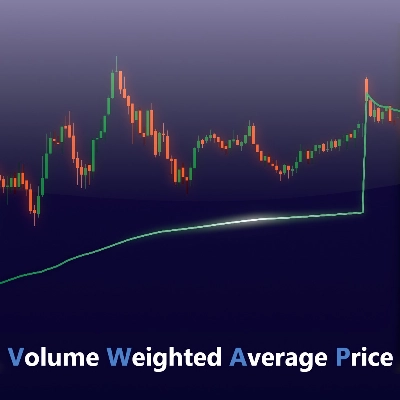
Tool comparison
Product | Reviews | Downloads | Sales | Price | Compatible platforms |
|---|---|---|---|---|---|
Free Smart Money Concepts (SMC) from TradingView | 5.0 (12) | 4.17K | — | Free | Windows, Mac |
Supertrend Indicator v1.1 | 4.5 (4) | — | 34 | $19 | Windows, Mac |
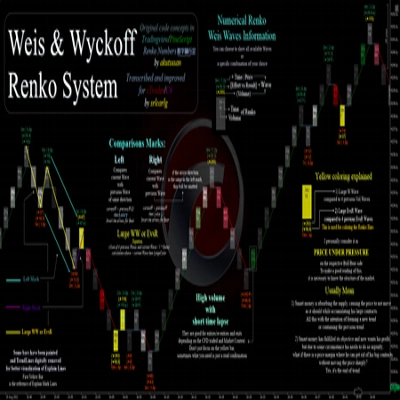
Weis & Wyckoff System v2.0 | 5.0 (3) | 2.6K | — | Free | Windows, Mac |
Trading View To Ctrader | 4.3 (3) | — | 19 | $50 | Windows, Mac, Mobile, Web |
SuperTrend from TradingView | 5.0 (3) | 840 | — | Free | Windows, Mac |
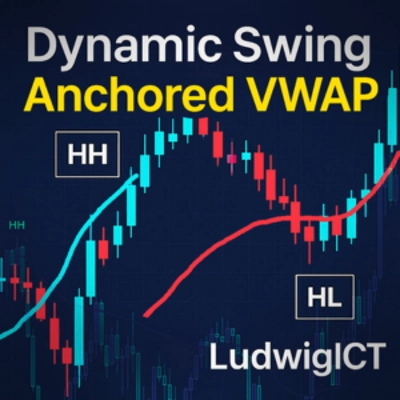
Dynamic Swing Anchored VWAP | 4.7 (3) | — | 4 | $49 | Windows, Mac |
Supertrend TV | 5.0 (3) | 668 | — | Free | Windows, Mac |
ICT Concepts from TradingView | 4.5 (2) | — | 4 | $49 | Windows, Mac |
Exhaustion Hunter | — | 118 | — | Free | Windows, Mac |
TradingViewMACD | 5.0 (1) | — | 3 | $19 | Windows, Mac |
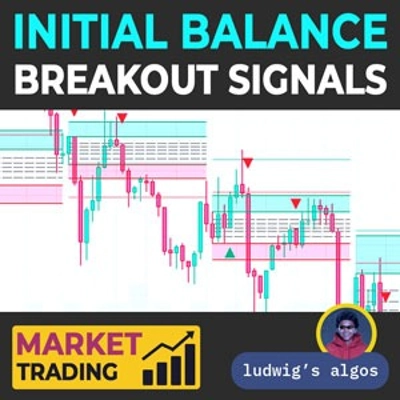
Initial Balance Breakout Signals | 5.0 (2) | — | 2 | $49 | Windows, Mac |
Tradingview Economic Calendar onn Chart | 4.8 (4) | — | 1 | $20 | Windows, Mac |
Stochastic Momentum Index | 4.3 (4) | — | 1 | $19 | Windows, Mac |
Trend & Volume Regime Map | 4.0 (4) | — | — | $19 | Windows, Mac |
TradingView ATR | 5.0 (3) | — | — | $19 | Windows, Mac |
VWAP Volume Weighted Average Price | 4.4 (5) | — | — | $25 | Windows, Mac |
FIBONACCI ARCHITECT PRO | 4.5 (2) | — | — | from $14 | Windows, Mac |
RSI Indicator | — | — | — | $19 | Windows, Mac |
FAQ
A TradingView-style indicator is a cTrader rebuild of a study known from TradingView, such as a Supertrend variant, with familiar lines and signals. It is an independent developer's implementation rather than the original script, so values can differ slightly from what the other platform shows.
Pine Script code cannot run in cTrader, so each port is rewritten for cTrader's own API, and small choices change the output. Different smoothing methods or starting values, the broker's price feed and session times can all shift lines and move a signal by a bar.
Some do, because a signal on the still-forming bar can appear and vanish before it closes. Tools that need later bars to confirm a pivot also place marks back in time, so compare a few live bars with how those bars look once more have formed.
No, arrows and coloured lines are drawings on the chart, and acting on them is your decision. Automating such a signal would require a cBot, and the trend cBot sample in the Help Centre knowledge base shows how coded entry rules work, though it is an example rather than a strategy to copy.
Traders apply them to forex, gold, indices and crypto such as BTCUSD, where behaviour varies with each market's volatility and trading hours. Store indicators need the Windows or Mac app, where you can compare marks across several symbols and timeframes and note how many signals failed within a few bars.