Brokers & props
For business
00
Days
:
00
Hours
:
00
Minutes
:
00
Seconds
Indicator
NAS100
NZDUSD
Martingale
Forex
Fibonacci
EURUSD
MACD
BTCUSD
SMC
Indices
ATR
Stocks
Grid
RSI
Breakout
XAUUSD
FVG
Commodities
Signal
Bollinger
GBPUSD
AI
VWAP
ZigZag
Prop
Supertrend
Crypto
USDJPY
Scalping
Trend & Volume Regime Map
16/01/2026
Desktop
Since 04/03/2025
Traded volume
37.76M
Pips won
6.05M
Sales
57
Free installs
3006
"Trend & Volume Regime Map" uploaded image"Trend & Volume Regime Map" uploaded image

Short description

Trend & Volume Regime Map is a regime filter for cTrader that measures the direction and persistence of both price and volume. It gives you a normalized trend score and a volume trend score in the range –10 to +10, colors your candles with a smooth gradient from bearish red to bullish green, and shows whether the current environment is risk-on, risk-off, or just noisy.


🧠 What it does

This indicator replicates the logic of BigBeluga’s “Regime Filter” from TradingView, adapted for cTrader and wrapped into a clear trend & volume regime map.

Smoothed price & volume

  • Calculates HLC3 (average of High, Low, Close) and applies a Hull Moving Average (HMA) to smooth price.
  • Applies another Hull Moving Average to tick volume.

Trend score (price)

  • For the last N bars (Length), it compares the current HMA of price to each past HMA value:
    • If current HMA > past HMA → trend +1
    • If current HMA ≤ past HMA → trend –1
  • The accumulated score is scaled to –10 … +10 → this is the Trend value.

Volume trend score

  • Uses the same logic, but applied to the HMA of volume.
  • The result is another normalized score in –10 … +10 → the Volume value.
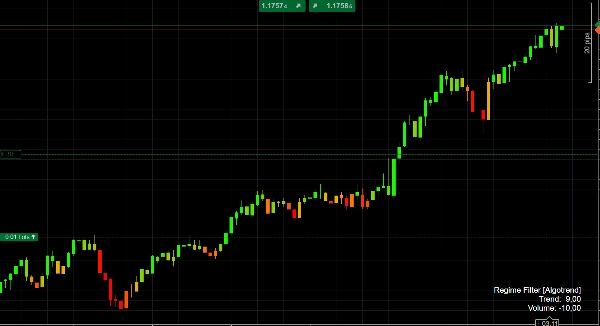
Color logic

  • When the Trend score is negative, candles are colored with a gradient red → orange depending on how strong the down regime is.
  • When the Trend score is positive, candles are colored orange → lime, with stronger green for stronger up regimes.

This gives you an instant visual cue of whether price action is bearish, neutral, or bullish, and how persistent that regime currently is.
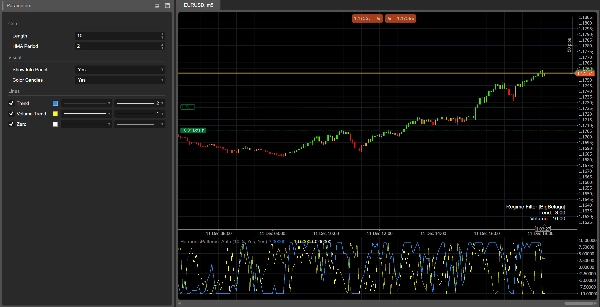
Regime panel

In the sub-window, the indicator plots:

  • Trend line (blue)
  • Volume trend line (gray)
  • Zero line (baseline)

On the last bar it prints a small info panel with the current Trend and Volume values.


🎯 How you can use it

Trend confirmation

  • Trade only in the direction of a strong regime, for example:
    • Trend > +4 → long-only bias
    • Trend < –4 → short-only bias

Regime filter

  • Switch off or scale down your strategy when the regime is weak (Trend near 0) or when the Volume trend is strongly negative, which often signals choppy or fading moves.

Context for signals

Combine your existing entry signals (price action, harmonic patterns, oscillators, etc.) with Trend & Volume Regime Map as a macro filter:

  • Only take breakouts when Trend is positive and Volume trend is also positive.
  • Avoid mean-reversion setups when Trend is extremely strong (> +8 or < –8), as the market is in a powerful directional regime.


⚙️ Input parameters

Core

Length
Number of bars used to build the trend and volume scores.

  • Higher values → smoother, more “macro” regime; slower to change but more stable.
  • Lower values → faster response, but more noise and more frequent flips.

HMA Period
Period of the Hull Moving Average used to smooth both price and volume.

  • Adjust it to match your timeframe and trading style: shorter for low timeframes, longer for higher timeframes.

Visual

Show Info Panel
Shows/hides the small text panel on the last bar with the current Trend and Volume scores.

Color Candles
Enables candle coloring based on the Trend value (red / orange / green gradient). Turn it off if you prefer to keep your default chart colors.


✅ Interpretation cheat sheet

  • Trend ≥ +7 → strong bullish regime, candles bright green.
  • Trend between +3 and +7 → bullish bias; pullbacks are potential dip-buy zones.
  • Trend between –3 and +3 → sideways / choppy; signals are less reliable.
  • Trend ≤ –7 → strong bearish regime, candles deep red.
  • Volume trend > 0 → rising / sustained activity, moves are more likely to be “real” and persistent.
  • Volume trend < 0 → fading participation, higher risk of fake moves, chop, or reversals.


0.0
Reviews: 0
Customer reviews
No reviews for this product yet. Already tried it? Be the first to tell others!
More from this author
Indicator
NAS100
NZDUSD
Martingale
+26
Volume Delta
Read aggressive flow in real time. Flexible resets (Day/Week/Month), optional EMA smoothing, and non-repainting cumulati
cBot
NAS100
NZDUSD
Martingale
+26
Prop Ready Bot_v.2.0
The Prop-Ready Bot The Definitive Automaton for Challenges 🛡️ V2.0
Indicator
Grid
NZDUSD
XAUUSD
+16
vWAP Free
Editions: Free (core VWAP + bands) · Pro (multi‑VWAP, click‑to‑anchor, alerts).
cBot
Grid
NAS100
RSI
+20
Breakout Premium Pro v2.0
A price-action-first algorithm to trade Breakout, Approach, and Return around prior High/Low levels—with Prop-style risk
cBot
NAS100
NZDUSD
Martingale
+26
ElliottWaveBot
N.B.: Results with an initial invested capital of 100 euros.
Indicator
ZigZag
Indices
Breakout
+1
Auto Tools Suite
Auto Trendlines, Fibonacci, Pitchfork and Patterns from non‑repainting pivots. One‑click Presets, targeted Alerts, and a
Indicator
NAS100
NZDUSD
Martingale
+26
Breakout channel
Breakout Channels automatically detects consolidation ranges and highlights when price breaks out of them.
cBot
NAS100
NZDUSD
Martingale
+26
TradeCopierBot
✅ Buy 3 prop accounts and manage just 1: cut management effort by 66% with a professional tool.
Indicator
NAS100
NZDUSD
Martingale
+26
Volume Bubble
Volume Bubbles is a lightweight yet powerful visual indicator for cTrader
cBot
NAS100
NZDUSD
Martingale
+26
ElliottWave Pro cBot
The Elliott Wave Pro Bot is a sophisticated and highly configurable algorithmic trading system
Indicator
NAS100
NZDUSD
XAUUSD
+14
ZIG ZAG Free
ZigZag Free is a clean swing-detection tool that marks significant pivot highs/lows
cBot
Grid
Indices
Breakout
+7
Scalper Pro PROP
Breakout scalping with prop-firm grade equity control.
Indicator
NAS100
NZDUSD
Martingale
+26
Liquidity Shift Indicator
Want a cBot based on this indicator? Contact us!
cBot
NAS100
NZDUSD
Martingale
+26
Dynamic Trendline Deluxe Pro Cbot - PROP edition
Major Update Announcement: Advanced Prop Firm Risk Management is Here! 🚀
Indicator
Grid
NAS100
NZDUSD
+15
EMA UP&DOWN 2025
SectorIndex Dual Moving Average Indicator: Your Market Compass 🧭
cBot
NAS100
Indices
XAUUSD
+7
COT Institutional Sentiment Bot
Institutional COT sentiment, automated position trading and full prop-firm style risk control – all in one cBot.
Indicator
NAS100
NZDUSD
Martingale
+25
Volume Profile Suite trial7D
DEMO VERSION 7 DAYS VolumeProfileSuite is an advanced and flexible Volume Profile indicator for cTrader.
cBot
Indices
ATR
US500 LONG&SHORT TF 5M ALL SEASON!
🚀N.B.: Results with an initial invested capital of 100 euros.
You may also like
Indicator
Signal
Scalping
9-5-3 Trading Strat
Enhance Your Trading Strategy with the Larry Williams 9-5-3 Indicator
Indicator
NAS100
Indices
XAUUSD
+6
cAlgoBuddy - Boxify
The purpose of the algorithm of the Boxify indicator is to try to put price action into zones, or better, boxes.
Cumulative Delta Candles + VolumeProfile
Cumulative delta candles + volume profile
Time Marker
CaptraTimeMarker: Marks key trading hours with lines & labels, plus daily separators for cTrader. Customizable & precise
Indicator
Grid
RSI
Breakout
+20
Logarithmic Framework by LudwigICT
Indicator
Prop
Scalping
MM-HTF Bars
Shows bars from different Time Frame on zoom out and hides the current bars. Perfect tool for Multi TF "Market Reply"
JMA-Like
JMA-like is a highly responsive and ultra-smooth moving average designed to replicate the behavior of the original JMA!
Indicator
RSI
Breakout
XAUUSD
+5
Zones Supply Demand
📊Zones Supply & Demand: Identifies key price levels with high volume concentration, marking Supply/Demand Zones & Marke
VegaXLR - Candlestick Patterns Alerts
Real-Time Candlestick Pattern Detection with Custom Alerts & Trend Analysis for cTrader
Indicator
Indices
XAUUSD
Forex
+4
Woodie_CCI
The Woodie CCI Indicator (Woodie Commodity Channel Index) is a variation of the classic CCI indicator
Indicator
Indices
Commodities
CCI - With Arrows and 40 80 EMA Logic_noSourceCode
The Advanced CCI & EMA Indicator combines the CCI with 40 & 80 EMA logic to generate precise arrows signaling direction
Indicator
Indices
RSI
Prop
+4
SuperEmaColorRSI
This is a super indicator that integrates the RSI indicator with a dual moving average system.
Indicator
RSI
Signal
MACD
[Stellar Strategies] Moving Averages Combined 1.0
Smooths price action with 6 MAs (3 SMA, 3 EMA). Reduces noise, clarifies trends 📈📉
Indicator
FVG
Forex
Volume Profile Price
Volume Profile Price Period and Live VAH,VAL,POC,
Indicator
Indices
Prop
Breakout
+4
Higher TimeFrame Candle Tracker
Higher TimeFrame Candle Tracker: Current Timeframe (Any TimeFrame) Show High TimeFrame Candle Bar
Indicator
NAS100
Indices
XAUUSD
+6
TRWatermark_v1.0
Customizable corner watermark — display symbol, timeframe, broker, or a live candle countdown without cluttering chart
Indicator
Indices
RSI
Signal
Rsi + Volume
This indicator combines RSI (Relative Strength Index) with volume analysis to generate more reliable trading signals.
Indicator
Indices
Prop
Stocks
+3
Equity and Balance
Displays real-time balance, equity, P&L, margin metrics directly on your charts.