"Time To Break Even Indicator v2" logo
Time To Break Even Indicator v2
"Time To Break Even Indicator v2" uploaded image
Since 26/05/2025
200
Free installs

Time To Break Even Indicator v2

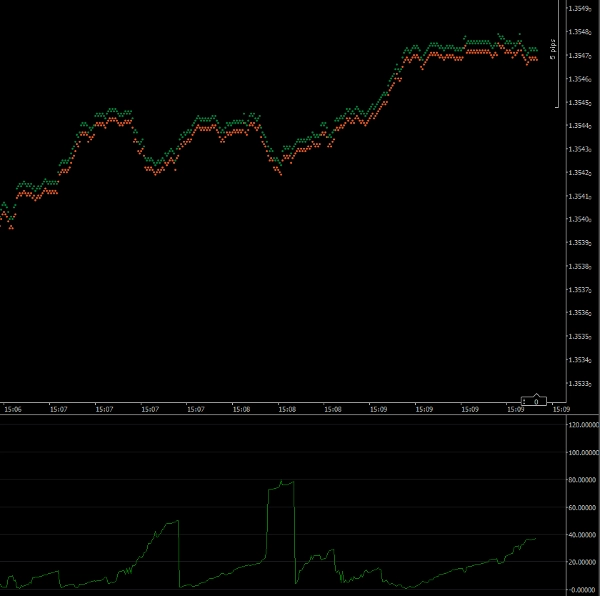
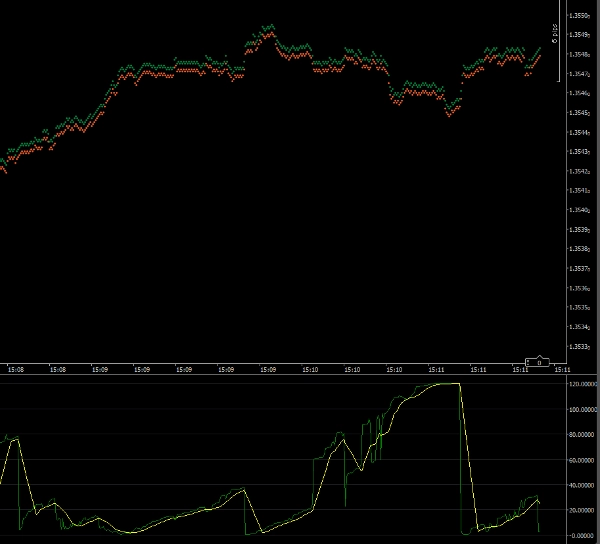
This indicator will help you time your trade's entry into the market. The plot shows you the likely number of seconds for your trade to break even. If the market is moving fast and in your direction, then the indicator will give a small number. If the market is moving against you or slowly, the number will be larger.

The indicator calculates the number of pips that your trade requires to break even. It then compares this with the current speed at which the price is moving.


N.B. This indicator should be run on the 1 Tick Time Frame.
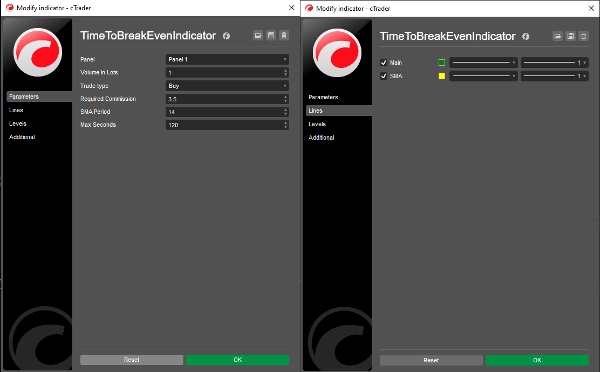

Parameters

Volume in Lots: The volume of your proposed trade

Trade Type: Whether your trade is to be a buy or a sell

Required Commission: The commission your trade will incur (you can get this from the Quick Trade window)

SMA Period: The period of the Simple Moving Average plot (default = 14)

Max Seconds: The maximum number of seconds that will be recorded (see below)

Lines

Main: The indicator plot line (default = green)

SMA: The Simple Moving Average plot line (default = yellow)


Max Seconds

Allowing the indicator to display very large values means that the scale of the indicator will prevent you from seeing the detail when the time to break even is small. Setting this parameter enables you to set the maximum scale of the indicator. By default it is set to 120 (2 minutes). So any output of 2 minutes or more will be plot as 120 seconds.


Dr Andy Larkin

Copyright 2025, All Rights Reserved

26th May 2025


Legal

Results from the this indicator should be checked for accuracy before using in live trading.

No warranty is given or implied for the results of this indicator.

No liability is accepted for any losses incurred as a result of using this indicator.

Indicator profile
0.0
Reviews: 0
Customer reviews
No reviews for this product yet. Already tried it? Be the first to tell others!
Products available through cTrader Store, including trading bots, indicators and plugins, are provided by third-party developers and made available for informational and technical access purposes only. cTrader Store is not a broker and does not provide investment advice, personal recommendations or any guarantee of future performance.

More from this author

This Indicator will display either the speed or the acceleration of the current symbol.
This is the trial version of Time To Break Even, which help you time your trade entry.

You may also like

This is the first version I offer you for free.
BullBear Dynamics helps traders detect and interpret the balance between bullish and bearish momentum
🔍 Automatically detect support and resistance levels based on "swings" or pivots
Amplitude Momentum Optimizer — FREE TRIAL Version to Find Out If the Complete Indicator Has a Real Edge.
Forex Strength Meter for cTrader: 4 custom currencies, cross alerts, visual arrows. Trade smarter!
INSTITUTIONAL VWAP
Smart ICT Concepts indicator from TV: combining FVGs, Liquidity, Order Blocks, and Market Structure in one tool.
Counts bars from the start of the sessions.
LineHelper is your complete line-drawing assistant for setting up trading zones quickly
Detects HTF bias using CRT, Expansion & Swing Point patterns with SMT/PSP divergence — visualised in a floating candle
Stay ahead with a real-time countdown to candle closes on all key timeframes: 5m, 15m, 30m, 1H, 4H, and Daily.
Buy/Sell signals filtering noise, color-coded trends & strength shield 🛡️. Trade only with POWER ⚡
Analyzes candles (adjustable period): dominance, difference, and volatility in pips for market reading.
ORB Levels PRO – Advanced Opening Range Breakout Tool Master the Market Open with Precision. Europe & US Opening Ranges
Institution-level trend Analyzer.
Breakout Multi-Timeframe Strategy Indicator
The WaveTrend Indicator is a multifunctional oscillator designed to center the trend wave or movements in the trend.
🔷 Multi-Layer Market Structure & Dynamic Regression Indicator / Trend Lines
Since 26/05/2025
200
Free installs