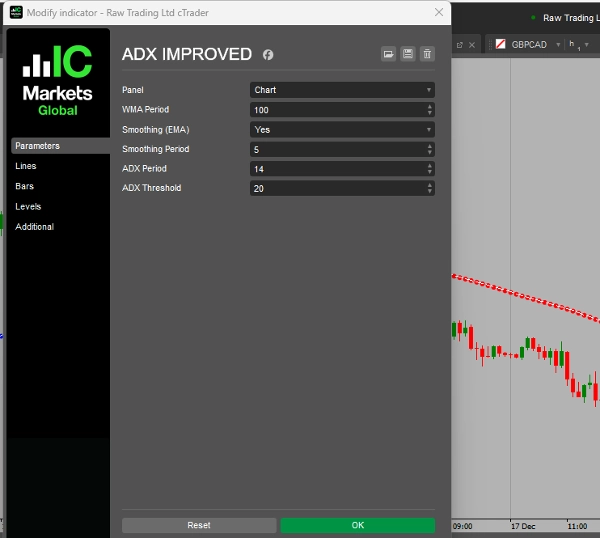
ADX IMPROVED
Indicator
Version 1.0, Aug 2025
Windows, Mac
Description
The SmartADXWMAIndicator is a versatile custom tool for technical analysis. It combines two core components to help traders identify and follow market trends:
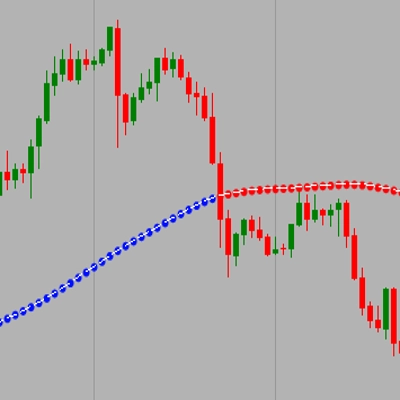
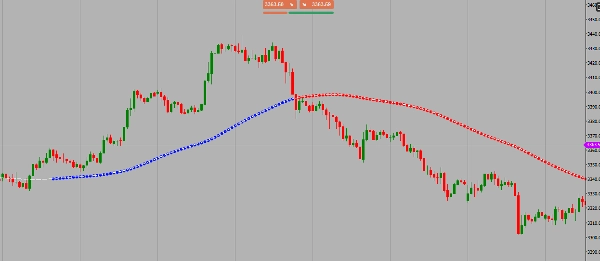
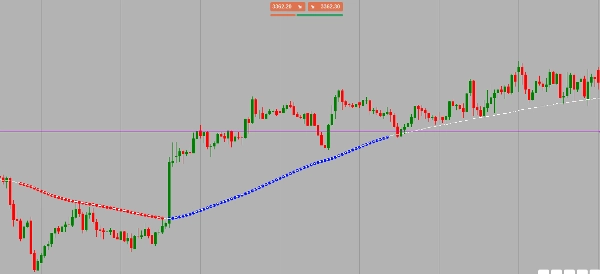
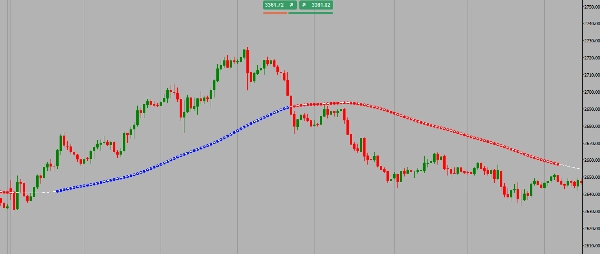
- A Smoothed Trend Line: The indicator calculates a Weighted Moving Average (WMA) of the closing price. It then applies an Exponential Moving Average (EMA) to that WMA, creating a single, smooth line on the chart. This line is designed to be highly responsive to recent price action while still filtering out minor volatility, giving you a clear visual representation of the current trend's direction.
- Signal Dots for Trend Confirmation: It uses the Average Directional Index (ADX), an advanced momentum indicator, to confirm the strength of the trend. When the ADX value rises above a user-defined threshold, it signals that the market is in a strong, sustained trend.
How It Works Together
The indicator's power lies in its combined approach. It doesn't just show a trend line; it also provides precise visual signals.
- A green dot appears directly on the trend line when the ADX is above the threshold and the price is above the trend line, confirming a strong bullish trend.
- A red dot appears when the ADX is above the threshold and the price is below the trend line, confirming a strong bearish trend.
This combination allows traders to easily see when a market is trending, what direction it's moving, and when to potentially consider a trade entry or exit based on the relationship between price and the trend line.
For swing trade, you can try wma 100 and threshold 20 or 25.
Summary
Indicator profile
Customer reviews
0.0
Reviews: 0
Customer reviews
No reviews for this product yet. Already tried it? Be the first to tell others!
Discussion
FAQ
Products available through cTrader Store, including trading bots, indicators and plugins, are provided by third-party developers and made available for informational and technical access purposes only. cTrader Store is not a broker and does not provide investment advice, personal recommendations or any guarantee of future performance.


!["Smart Money Concepts (SMC) [Iridio Capital]" logo](https://cdn.ctrader.com/image/webp/28b69fd1-ef54-4bed-9487-07e78e883be4_40934)


Price
Since 15/12/2024
3.6M
Traded volume
2.05M
Pips won