Indicator
NAS100
NZDUSD
XAUUSD
Commodities
Forex
EURUSD
GBPUSD
BTCUSD
Indices
Prop
Stocks
Crypto
USDJPY
Atlas Seasonal Returns Heatmap
"Atlas Seasonal Returns Heatmap" logo
21/09/2025
1
Desktop
Since 13/08/2025
Sales
16
Free installs
219
"Atlas Seasonal Returns Heatmap" uploaded image"Atlas Seasonal Returns Heatmap" uploaded image

🧭 Time your trades by the clock: Atlas reveals when markets tend to move by month, weekday, and hour. 🧭

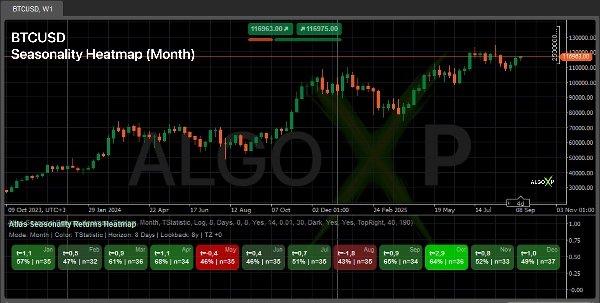
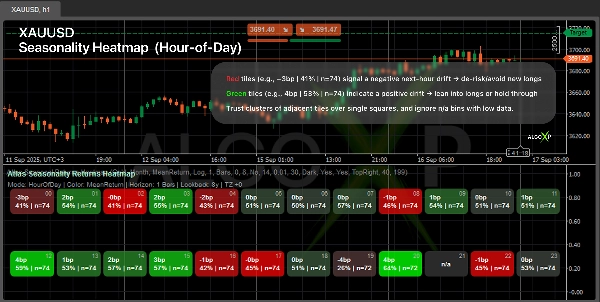
See when your market tends to move — by Month, Day-of-Week, or Hour-of-Day.
Atlas computes forward returns over a horizon you choose and paints a symmetric heatmap (Down → Zero → Up). Each tile shows a metric (Mean, T-stat, or Sharpe) plus hit% | n. Use it to time entries/exits, plan sessions, and filter risk.

🎯 Why traders use it

  • Spot green windows to lean in and red windows to stand down.
  • Plan sessions around statistically favorable hours/days.
  • Add a clean “when” layer to discretionary and systematic strategies.

⚙️ How it works

  • Looks ahead over a window you choose and summarizes how price tends to behave in that window.
  • Groups the results into time buckets (Month / Weekday / Hour) and respects your timezone.
  • Applies outlier protection and a robust strength score per bucket (plus sample size).
  • Paints a balanced heatmap around neutral using your Up / Zero / Down colors.

👥 Who it’s for

  • Discretionary traders — better timing and sizing by session.
  • System & bot builders — a time filter / time-sizing layer for strategies.
  • Crypto & index traders — quick behavioral patterns across days/hours.
  • Beginners — simple read: greener = more positive bias over your chosen horizon.

🚀 Quick start

  • Pick Asset Preset (Forex/Crypto/Index/Gold).
  • Set Horizon (e.g., 1 Hour for HOD, 1 Day for DOW/Month).
  • Tune Lookback, Min Observations, and colors.
  • Read clusters (several adjacent green/red tiles) for the strongest cues.

ℹ️ Seasonality isn’t a guarantee of future results. It’s a statistical pattern that depends on the period and methodology. Use the indicator as context for your entry/exit rules and risk management, test robustness across multiple lookback windows, and avoid relying on bins with low n (sample size).


More from this author
cBot
Grid
XAUUSD
Prop
+3
Maya Gold Grid ATR - TEST VERSION
🌞 Smart Gold Grid. ATR Precision. + 1 800 000% ROI in 6 years backtest 🌞
cBot
Grid
Prop
XAUUSD
+3
Maya Gold Grid ATR
🌞 Smart Gold Grid. ATR Precision. +35% in 30 Days🌞
Indicator
NAS100
NZDUSD
XAUUSD
+11
Samurai Breakout Lite
⚔️Limited version. Draws clean session box (Tokyo / London / New York / Overlap) and optional breakout plan (EP/TP/SL)⚔️
Indicator
NAS100
NZDUSD
XAUUSD
+11
ADXVMA Aurora Trend Filter
⚡ ADXVMA Aurora Trend Filter combines ADX trend strength with an adaptive EMA blend ⚡
Indicator
NAS100
NZDUSD
XAUUSD
+12
Coral Filter Lite
🐠 Free trend baseline - without the noise. Free limited version of Coral Filter X Pro 🐠
Indicator
NAS100
NZDUSD
Breakout
+12
Samurai Breakout Pro II
⚔️Full breakout trading workstation: session box, EP/TP/SL levels, on-chart ✓/✗ outcomes, pro-level analytics and more⚔️
Indicator
NAS100
NZDUSD
XAUUSD
+11
Support and Resistance Lite
🟢 Real swing-based support & resistance with ATR-powered half-bands 🔴
Indicator
NAS100
NZDUSD
Breakout
+13
Meridian Pivot Points Pro
🚀See the market’s framework, decide faster. Session-Aware Pivots. Auto Presets. Pro-Grade Zones.🚀
Indicator
NAS100
NZDUSD
XAUUSD
+12
Coral Filter X Pro
🐠 Coral Filter X Pro turns trend detection into a simple, repeatable workflow 🐠
Indicator
NAS100
NZDUSD
XAUUSD
+10
Nebula Range Filter Pro
⚡Nebula Range Filter is a professional trend filter indicator for cTrader⚡
Indicator
NAS100
NZDUSD
XAUUSD
+10
Tsunami Volume Surge - RVOL
🌊 See when the market is truly in play. Tsunami measures Relative Volume by time-of-day 🌊
You may also like
Indicator
Breakout
VIX - volatility indicator - Renko
Volatility indicator for Renko.
ICT Killzones & Macros
KILLZONES AND MACRO SESSIONS
Reko Wic
Visualize global Forex trading sessions with clear time blocks for better timing and strategy planning.
Indicator
XAUUSD
Commodities
Forex
+3
Silver Bullet by LudwigICT
Indicator
Signal
MeetAlgo_ChannelTrading_cTrader
Channel Trading is a volatility-based indicator using envelope theory to spot price breakouts and trade signals.
CandleColourFlow_Limited_EURUSD
CandleColourFlow – smart color-coded trend indicator.
Indicator
RSI
Indices
StochasticRSI
Stochastic RSI (StochRSI) is a technical indicator used to measure the strength and weakness of the RSI.
Indicator
VWAP
NAS100
XAUUSD
+7
Vwap Manav Indi Button
Automated VWAP bot executes trades at key volume-weighted average price zones with adaptive risk management
TDI_Pro
Traders Dynamic Index (TDI) — Divergence Edition
Indicator
XAUUSD
Forex
EURUSD
+2
ALMA Smoothed Gaussian Moving Average
ALMA Smoothed Gaussian Moving Average (ASGMA) – by LudwigICT
KANDIKA HEAT MAP
Color-Based Market Pressure & Volatility Visualizer The Kandika Heatmap Indicator
True Trend H4
It draws a step line that visualize the movement of H4. Particularly effective when trade on lower timeframe.
Indicator
Indices
Stocks
Forex
+1
VegaXLR - Moving Average Alerts
A powerful cTrader indicator with customizable Moving Average alerts, notifications, and automated trading actions.
Indicator
Stocks
Forex
Crypto
PinBarCandlestickPattern
PinBarCandlestickPattern Indicator
Indicator
Signal
dark-cloud
The Dark Cloud Cover indicator detects a bearish reversal pattern, marking key candles and confirming signals based on v
Renko 4k Pips
Custom your Renko Brick how do you wish!
Indicator
RSI
Breakout
XAUUSD
+7
Candle Strength Oscillator
The Candle Pressure Index is a powerful, user-friendly indicator that reveals hidden market pressure inside candles.
IR VLine
don't move to the end of chart after timeframe changing. it should be better to use for near history. for long history