คำอธิบาย
🚀 INSTITUTIONAL VWAP - ตัวบ่งชี้การซื้อขายระดับมืออาชีพ
เทรดเหมือนธนาคารและกองทุนเฮดจ์ด้วยราคาเฉลี่ยถ่วงน้ำหนักด้วยปริมาณที่แท้จริง
INSTITUTIONAL VWAP คือเครื่องมือที่เทรดเดอร์สถาบัน ผู้สร้างตลาด และแผนกมืออาชีพใช้เพื่อระบุมูลค่าที่เป็นธรรมและดำเนินการคำสั่งซื้อขนาดใหญ่โดยไม่ทำให้ตลาดเคลื่อนไหว ตอนนี้พร้อมสำหรับเทรดเดอร์รายย่อยที่ต้องการมองตลาดผ่านสายตาของสถาบัน
💎 ทำไม VWAP ถึงเป็นตัวบ่งชี้ที่สำคัญที่สุดสำหรับการซื้อขายสถาบัน
VWAP (ราคาเฉลี่ยถ่วงน้ำหนักด้วยปริมาณ) ไม่ใช่แค่ค่าเฉลี่ยเคลื่อนที่ธรรมดา - มันคือ ราคามาตรฐาน ที่สถาบันใช้วัดคุณภาพการดำเนินการ เมื่อธนาคารดำเนินการคำสั่งซื้อ 50 ล้านดอลลาร์ พวกเขาจะถูกตัดสินว่าซื้อสูงกว่าหรือต่ำกว่า VWAP นี่คือมาตรฐานของสถาบัน
✨ สิ่งที่ทำให้ VWAP นี้แตกต่าง:
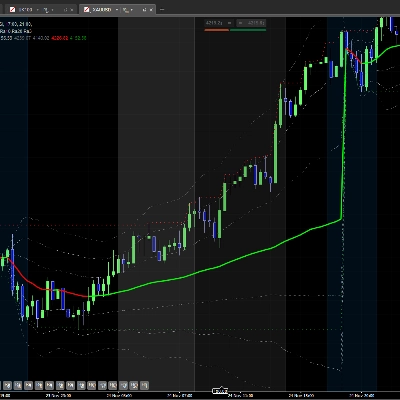
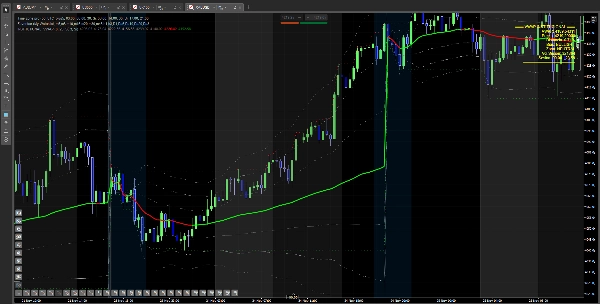
🎯 รีเซ็ตตามช่วงเวลาเซสชัน
- รีเซ็ตอัตโนมัติเมื่อเปิดตลาด (กำหนดชั่วโมงได้)
- คำนวณ VWAP ภายในวันจริง ไม่ได้นำมาจากวันก่อนหน้า
- แสดง "ราคาที่เป็นธรรม" ของเซสชันวันนี้เท่านั้น
📊 แถบเบี่ยงเบนมาตรฐานสามระดับ
- 3 ระดับของแถบเบี่ยงเบนทางสถิติ (±1σ, ±2σ, ±3σ)
- ระบุเมื่อราคาซื้อเกินหรือขายเกินทางสถิติ
- 68% ของการเคลื่อนไหวราคาจะอยู่ใน ±1σ, 95% ใน ±2σ, 99.7% ใน ±3σ
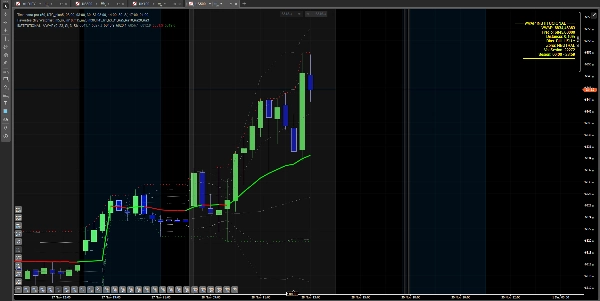
🎨 เส้น VWAP ที่มีสีสันแบบไดนามิก
- สีเขียวเมื่อ VWAP กำลังขึ้น (แรงกดดันซื้อจากสถาบัน)
- สีแดงเมื่อ VWAP กำลังลง (แรงกดดันขายจากสถาบัน)
- ยืนยันภาพทันทีถึงความรู้สึกของสถาบัน
📈 เครื่องหมายสูง/ต่ำรายวัน
- ติดตามและแสดงสูงต่ำของเซสชันโดยอัตโนมัติ
- ระดับสำคัญที่มีการสะสมจุดหยุด (โซนสภาพคล่อง)
- เทรดเดอร์สถาบันตั้งเป้าระดับเหล่านี้สำหรับการกลับตัว
🔍 โซนสถาบันทันที
- "EJECUCIÓN ÓPTIMA" - ราคาที่ใกล้ VWAP (โซนเข้าที่ดีที่สุด)
- "SOBREEXTENDIDO" - ราคาห่างจาก VWAP (มีแนวโน้มกลับตัว)
- "NEUTRAL" - การเคลื่อนไหวราคาปกติ
🎯 วิธีที่เทรดเดอร์สถาบันใช้ VWAP
กลยุทธ์ 1: การเทรดตามกระแสสถาบัน
เมื่อ VWAP เป็นสีเขียว (กำลังขึ้น): สถาบันกำลังสะสม (ซื้อ) ซึ่งหมายความว่า:
- มีแนวโน้มซื้อ - มองหาโอกาสซื้อเท่านั้น
- รอการดึงกลับมาที่เส้น VWAP
- เข้าเมื่อราคาสัมผัส VWAP และเด้งกลับ
- หยุดขาดทุน: ต่ำกว่า VWAP หรือ ต่ำกว่าแถบ -1σ
เมื่อ VWAP เป็นสีแดง (กำลังลง): สถาบันกำลังกระจาย (ขาย) ซึ่งหมายความว่า:
- มีแนวโน้มขาย - มองหาโอกาสขายเท่านั้น
- รอการดีดกลับมาที่เส้น VWAP
- เข้าเมื่อราคาสัมผัส VWAP และปฏิเสธ
- หยุดขาดทุน: สูงกว่า VWAP หรือ สูงกว่าแถบ +1σ
ทำไมมันถึงได้ผล: คุณกำลังเทรดไปกับเงินใหญ่ ไม่ใช่ต่อต้านพวกเขา เมื่อสถาบันกำลังซื้อ เส้นทางที่ต้านทานน้อยที่สุดคือขึ้น
กลยุทธ์ 2: การกลับตัวสู่ค่าเฉลี่ยจากแถบสุดขีด
การตั้งค่า: ราคาถึงแถบ ±2σ หรือ ±3σ (เกินมูลค่าที่เป็นธรรม)
ความเป็นจริงทางสถิติ:
- มีเพียง 5% ของเวลาที่ราคาจะอยู่เกิน ±2σ
- มีเพียง 0.3% ของเวลาที่ราคาจะอยู่เกิน ±3σ
- การกลับตัวสู่ VWAP มีความน่าจะเป็นสูง
การเทรดของคุณ:
- ราคาที่แถบ +3σ = โอกาสสูงในการขายกลับสู่ VWAP
- ราคาที่แถบ -3σ = โอกาสสูงในการซื้อกลับสู่ VWAP
- เป้าหมาย: เส้น VWAP
- หยุด: เกินแถบสุดขีด
ทำไมมันถึงได้ผล: คุณกำลังใช้สถิติ เมื่อราคาห่างจากค่าเฉลี่ย 3 ค่าเบี่ยงเบน ความน่าจะเป็นจะเอียงไปสู่การกลับสู่ค่าเฉลี่ย (VWAP)
กลยุทธ์ 3: การเข้าเทรดแบบดึงกลับของสถาบัน
การตั้งค่าที่สมบูรณ์แบบ:
- VWAP เป็นสีเขียว (สถาบันกำลังซื้อ)
- ราคาขยับแรงออกจาก VWAP (ถึง +1σ หรือ +2σ)
- ราคาดึงกลับมาที่ VWAP
- ราคาสัมผัสเส้น VWAP แต่ VWAP ยังคงเป็นสีเขียว
- เข้าเทรดซื้อ - สถาบันยังคงซื้อในช่วงดิ่งลง
ทำไมสิ่งนี้ถึงเป็นทองคำ: คุณกำลังซื้อที่ "ราคาที่เป็นธรรม" ของสถาบันในช่วงแนวโน้มขาขึ้นที่ได้รับการยืนยัน นี่คือวิธีที่กองทุนเฮดจ์สะสมตำแหน่ง - พวกเขาแบ่งคำสั่งเป็นชิ้นเล็ก ๆ และซื้อทุกการดึงกลับสู่ VWAP
กลยุทธ์ 4: หลีกเลี่ยงกับดัก - เมื่อไม่ควรเทรด
อย่าซื้อเมื่อ:
- ราคาสูงกว่าแถบ +2σ (เกินไป, มีแนวโน้มดึงกลับ)
- VWAP เป็นสีแดงแต่ราคาดีดกลับจากแถบล่าง (ดีดกลับแบบแมวตาย)
- ราคาข้าม VWAP ซ้ำ ๆ (แกว่งตัว, ไม่มีทิศทางสถาบันชัดเจน)
อย่าขายเมื่อ:
- ราคาต่ำกว่าแถบ -2σ (ขายเกิน, มีแนวโน้มดีดกลับ)
- VWAP เป็นสีเขียวแต่ราคาปฏิเสธจากแถบบน (แค่เก็บกำไร)
- คุณอยู่ในแนวโน้มที่แข็งแกร่ง - อย่าเทรดสวนแนวโน้ม
🔥 สิ่งที่ทำให้ INSTITUTIONAL VWAP เหนือกว่า
ตัวบ่งชี้ VWAP มาตรฐาน คำนวณจากการเปิดตลาด, ไม่รีเซ็ตอย่างถูกต้อง, แสดงเพียงเส้นพื้นฐาน, ไม่มีแถบเบี่ยงเบน, ไม่มีบริบทโซน และไม่มีการบ่งชี้อคติด้วยภาพ
INSTITUTIONAL VWAP คำนวณราคาเฉลี่ยถ่วงน้ำหนักด้วยปริมาณที่แท้จริงพร้อมรีเซ็ตเซสชันอย่างถูกต้อง, รวมชั่วโมงเซสชันที่ปรับแต่งได้, แสดงแถบเบี่ยงเบนมาตรฐาน 3 ระดับ, ให้การวิเคราะห์โซนแบบเรียลไทม์ (เหมาะสม/เกิน), มีการบ่งชี้อคติด้วยสี (เขียว/แดง) และแสดงระดับอ้างอิงสูง/ต่ำรายวัน
นี่คือความแตกต่างระหว่างตัวบ่งชี้พื้นฐานกับเครื่องมือการซื้อขายระดับมืออาชีพ
💰 สถานการณ์การซื้อขายจริง
สถานการณ์ 1: การสะสมของสถาบัน US30 เปิดตลาด VWAP เริ่มคำนวณจากการเปิดตลาด ตลอดช่วงเช้า VWAP ยังคงเป็นสีเขียวและราคายังคงดีดกลับจากมัน ทุกครั้งที่ราคาสัมผัส VWAP คุณซื้อ คุณทำการเทรด 4 ครั้ง ทุกครั้งชนะ ทำไม? เพราะสถาบันสะสมตลอดวัน และคุณซื้อกับพวกเขาที่ราคาที่เป็นธรรม
สถานการณ์ 2: การเทรดกลับสู่ค่าเฉลี่ย GBP/USD พุ่งขึ้นถึงแถบ +3σ จากข่าว ทุกคนตื่นเต้น คุณขาย ทำไม? เพราะราคาสูงกว่ามูลค่าที่เป็นธรรม 3 ค่าเบี่ยงเบน - สถิติบอกว่าต้องกลับสู่ VWAP 30 นาทีต่อมา ราคากลับสู่ VWAP คุณได้กำไร 60 จุดในขณะที่คนอื่นไล่ตาม
สถานการณ์ 3: หลีกเลี่ยงการหลอกลวงเบรกเอาท์ ทองคำทะลุสูงสุดรายวัน เทรดเดอร์ส่วนใหญ่ซื้อเบรกเอาท์ คุณตรวจสอบ VWAP - เป็นสีแดง (กำลังลง) คุณไม่เข้าเทรด ราคาเปลี่ยนทิศและลดลง 100 จุด VWAP บอกคุณว่าสถาบันไม่ได้ซื้อ - นี่คือกับดักรายย่อย
🎓 ใครที่ต้องการตัวบ่งชี้นี้?
✅ เทรดเดอร์รายวัน - VWAP คือมาตรฐานภายในวัน
✅ สแคปเปอร์ - การเข้าเทรดที่สมบูรณ์แบบเมื่อสัมผัส VWAP
✅ เทรดเดอร์สถาบัน - ใช้ VWAP อยู่แล้ว ตอนนี้มีภาพที่ดีกว่า
✅ เทรดเดอร์เงินฉลาด - ตามกระแสเงินใหญ่
✅ ใครก็ตามที่จริงจังกับการเทรด - นี่คือวิธีที่มืออาชีพเทรด
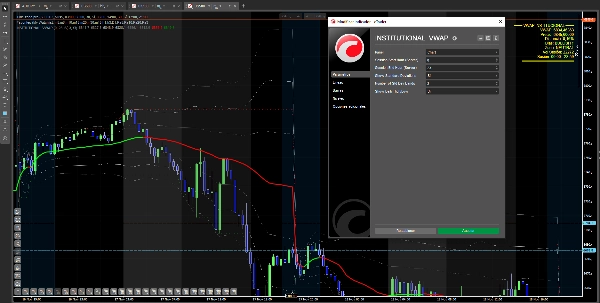
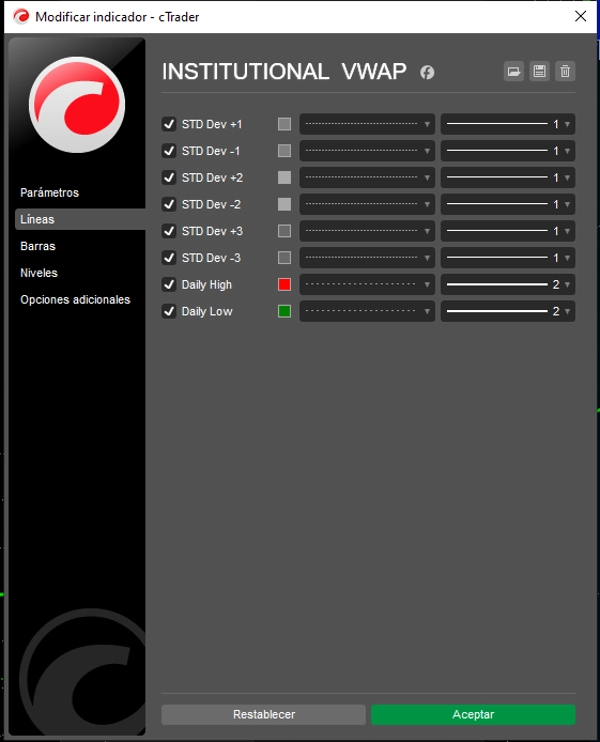
⚙️ ปรับแต่งได้เต็มที่
- ชั่วโมงเซสชัน - ตั้งเวลาเปิด/ปิดตลาดของคุณ (ลอนดอน, นิวยอร์ก, เอเชีย)
- แถบเบี่ยงเบนมาตรฐาน - เลือก 1, 2 หรือ 3 แถบ
- สูง/ต่ำรายวัน - เปิด/ปิดได้
- ความชอบด้านภาพ - ปรับแต่งสีและสไตล์
🛡️ การจัดการความเสี่ยงในตัว
แถบเบี่ยงเบนมาตรฐานคือการจัดการความเสี่ยงของคุณ:
การกำหนดขนาดตำแหน่ง:
- เข้าใกล้ VWAP = ตำแหน่งใหญ่ขึ้น (ความเสี่ยงต่ำ)
- เข้าใกล้ ±2σ = ตำแหน่งเล็กลง (ความเสี่ยงสูงขึ้น)
- ไม่เข้าเกิน ±3σ (รอการกลับตัว)
การวางจุดหยุดขาดทุน:
- เทรดยาว: ต่ำกว่า VWAP หรือ แถบ -1σ
- เทรดสั้น: สูงกว่า VWAP หรือ แถบ +1σ
- การกลับตัวสู่ค่าเฉลี่ย: เกินแถบสุดขีดที่คุณเทรดจาก
เป้าหมายกำไร:
- จาก VWAP ถึงแถบ ±1σ (แบบอนุรักษ์นิยม)
- จาก VWAP ถึงแถบ ±2σ (แบบปานกลาง)
- จากแถบ ±3σ กลับสู่ VWAP (การกลับตัวสู่ค่าเฉลี่ยแบบรุนแรง)
🚀 ขอบเขตการเทรดที่คุณพลาดไป
VWAP ตอบคำถามสำคัญสามข้อในการเทรด:
✅ มูลค่าที่เป็นธรรมคืออะไร? - เส้น VWAP
✅ ราคาถูกหรือแพง? - แถบเบี่ยงเบน
✅ สถาบันกำลังซื้อหรือขาย? - สีของ VWAP (เขียว/แดง)
ด้วย INSTITUTIONAL VWAP คุณไม่ต้องเดาอีกต่อไป คุณกำลังเทรดด้วยข้อมูล สถิติ และกระแสสถาบัน
📈 ใช้ได้กับทุกตลาดและกรอบเวลา
- ฟอเร็กซ์ - ทุกคู่หลักและรอง
- ดัชนี - US30, SPX500, UK100, NAS100, GER40
- สินค้าโภคภัณฑ์ - ทองคำ, เงิน, น้ำมัน, ก๊าซธรรมชาติ
- คริปโตเคอร์เรนซี - บิทคอยน์, อีเธอเรียม, อัลท์คอยน์
- กรอบเวลา - 1 นาทีถึง 1 ชั่วโมง (เน้นภายในวัน)
หมายเหตุ: VWAP เป็นเครื่องมือภายในวันเป็นหลัก รีเซ็ตทุกเซสชัน เหมาะสำหรับการเทรดรายวันและสแคปปิ้ง
🎁 เริ่มเทรดด้วยสติปัญญาของสถาบัน
หยุดเทรดแบบมืดบอด หยุดเดาว่าราคาควรจะอยู่ที่ไหน เริ่มเทรดด้วยมาตรฐานเดียวกับที่ธนาคารและกองทุนเฮดจ์ใช้
เห็นมูลค่าที่เป็นธรรม เทรดที่จุดสุดขีด ตามเงินสถาบัน
ตัวบ่งชี้นี้เข้ากันได้กับแพลตฟอร์ม cTrader ซื้อครั้งเดียว อัปเดตตลอดชีพรวมอยู่ด้วย


