Description
Forget about overloaded volume profile indicators that clutter your chart with unnecessary graphics and consume excessive system resources.
Over the years I used many different VP indicators and spent a significant amount of money on them. None of them delivered the balance of simplicity and quality I was looking for, so I decided to build my own approach.
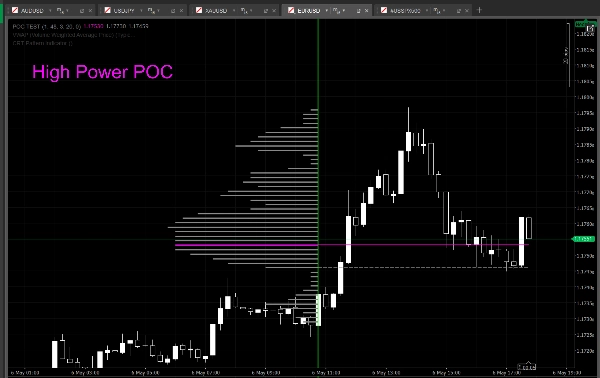
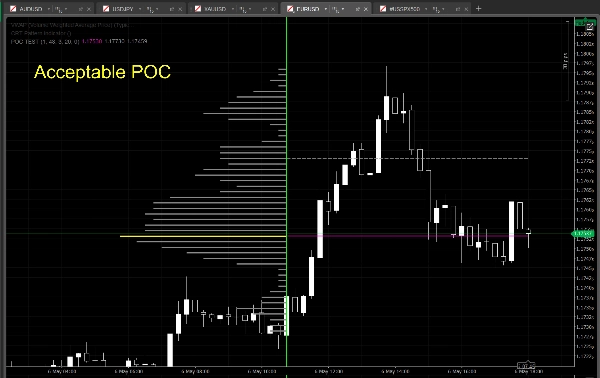
When you add the indicator to the chart, only a single vertical line appears. This line represents the candle where the calculation begins. The High / Low points after the selected candle are automatically detected by the indicator and used to dynamically determine the profile range boundaries. The histogram together with the POC / VAH / VAL levels is created instantly.
Your only job is to drag the start line onto the candle you want and, if necessary, define a Duration Minute limit from the input settings. Since the line snaps to candles like a magnet, incorrect alignment or accidental misuse is almost impossible.
Simple as that.
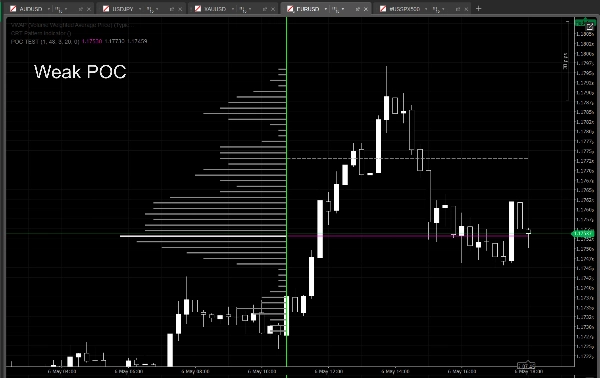
The histogram line corresponding to the POC uses 3 different colors to represent POC strength:
- White → Weak POC
- Yellow → Acceptable / balanced POC
- Magenta → Strong POC
Important note:
The candle where the start line is placed is NOT included in the calculation. The profile starts from the next candle after the selected one.
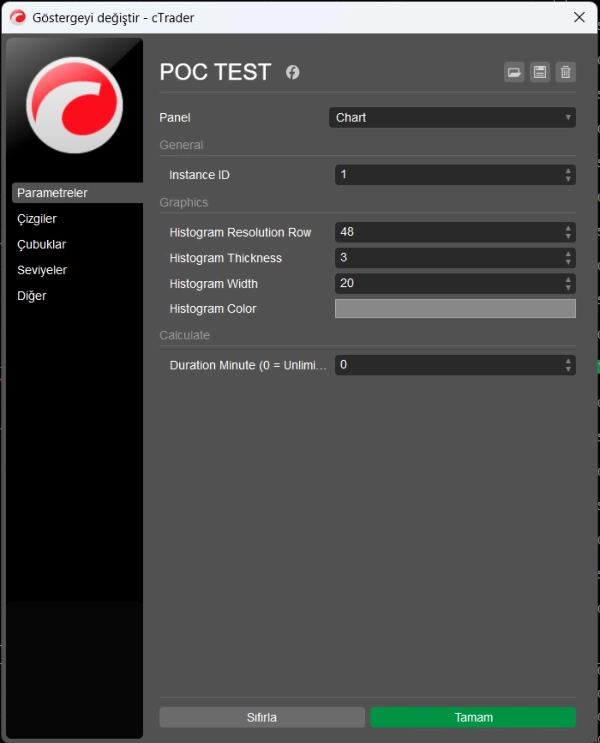
You can create multiple independent profiles on the same chart by using different Instance ID values.
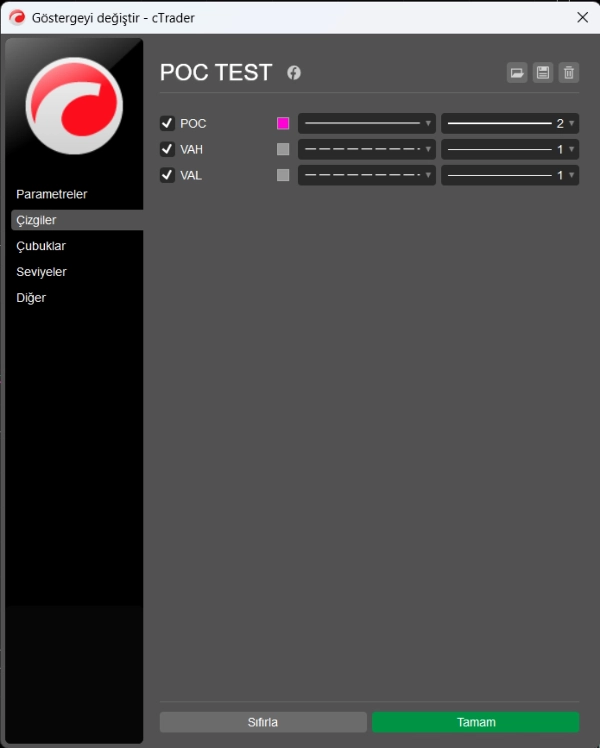
The parameter structure was intentionally kept simple. Instead of dozens of unnecessary settings, only the essential controls are included. Despite the clean appearance, the indicator runs a highly refined calculation engine in the background.
Some of the calculation methods used internally:
- Hybrid weighted volume distribution
- Close-price bias calculation
- Candle body weighting
- Sweep / wick filtering logic
- Cluster-based POC detection
- Dynamic POC strength analysis
- Adaptive Value Area expansion
- Stabilized VAH / VAL calculation
- Noise-reduced histogram generation
- Low-overhead real-time recalculation
Note:
- For simplicity and stability purposes, the parameter set has been intentionally kept limited. Users who require more advanced customization options can contact me directly. A dedicated advanced version may be released for them in the future.