present
Sign up and get $50 off your first purchase
Trading product for HAzigzagcycle_Bar Indicator Bollinger Bands AI-assisted, image 1
HAzigzagcycle_Bar
Indicator
Version 1.0, Apr 2026
Windows, Mac
Trading product for HAzigzagcycle_Bar Indicator Bollinger Bands AI-assisted, image 2
Trading product for HAzigzagcycle_Bar Indicator Bollinger Bands AI-assisted, image 3
Trading product for HAzigzagcycle_Bar Indicator Bollinger Bands AI-assisted, image 4
Since 16/03/2026

Description

HA_ZigzagCycle_Sub (サブウィンドウ用)

日本語説明

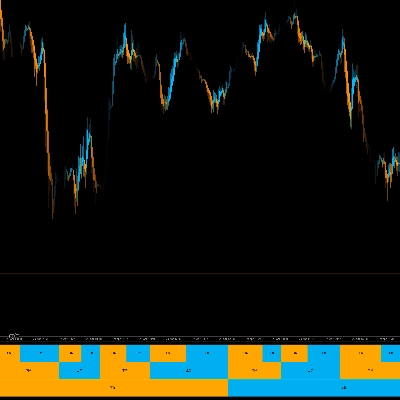
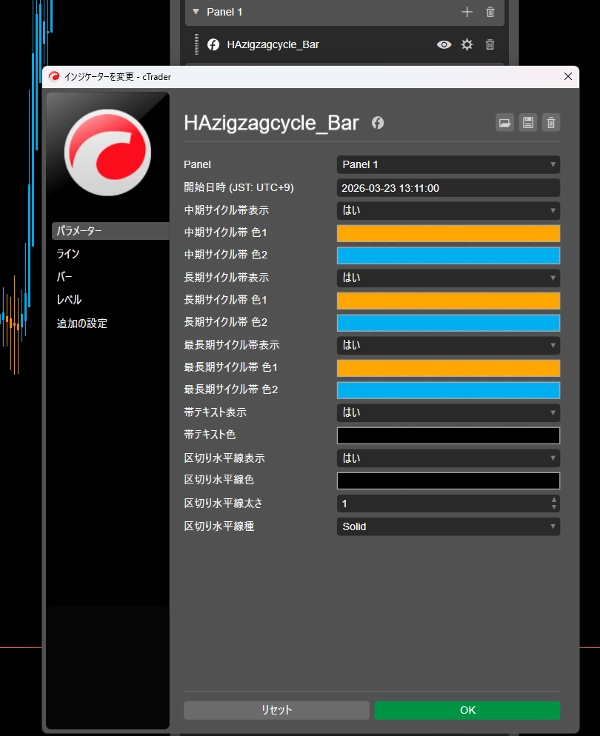
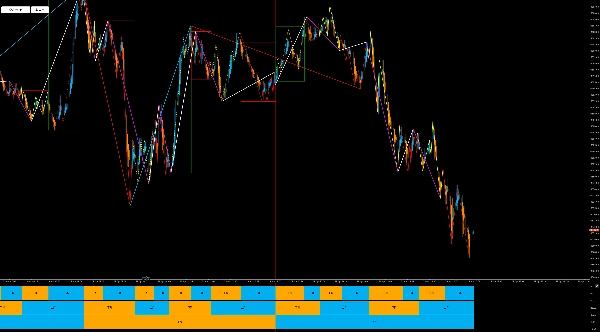
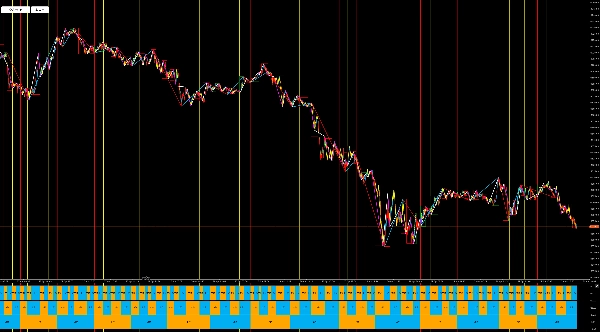
【製品概要】 HA_ZigzagCycle_Subは、メインチャートの「HA_ZigzagCycle」と完全に同期し、相場のサイクル状態をサブウィンドウにカラーバー形式で表示するインジケーターです。価格のノイズを排除し、時間の経過とともに進行するサイクルのリズムを視覚化します。

【主な機能と動作原理】

  • サイクル同期: メインインジケーターと同じ計算アルゴリズム(6波1サイクル)を使用し、同期したデータを表示します。
  • 3層のタイムサイクル表示:
    1. 中期 (Mid): 1つのサイクル(6波)ごとの切り替わり。
    2. 長期 (Long): 2つのサイクルをひとまとめにした期間。
    3. 最長期 (Max): 8つのサイクルを統合した巨大な波のリズム。
  • 視認性の高いUI: 上昇・下降のフェーズをテキストとカラーで表示し、現在の相場がどのサイクルのどの位置にいるのかを把握しやすくします。

【ユーザーが期待できること】

  • メインチャートが価格の上下で混雑していても、サブウィンドウを見るだけで現在の「サイクルの位置」を冷静に判断できます。
  • 長期サイクルと中期サイクルの色が一致するポイントを探すことで、強力なトレンドの合流点(コンフルエンス)を見つける助けとなります。

    ーーーーーーーーーーーーーーーーーーーーーーーーーーーーーーーーーーーーーーーーーーーーーーーーーーーーーーー

English Description

[Product Overview] HA_ZigzagCycle_Sub is a companion indicator designed to work in perfect synchronization with the "HA_ZigzagCycle" main system. It translates the complex wave structures of the main chart into intuitive, horizontal color bars in a sub-window.

[Key Features & Principles]

  • Synchronized Engine: Uses the exact same 6-wave cycle logic as the main indicator to ensure data consistency.
  • Triple-Layer Cycle Tracking:
    1. Mid Cycle: Visualizes individual 6-wave sequences.
    2. Long Cycle: Groups 2 cycles together.
    3. Max Cycle: Groups 8 cycles together to show the overarching market "breath."
  • Intuitive UI: Displays "Bullish/Bearish" phases (上昇/下降) using distinct colors and labels, providing a "rhythm-map" of the market.

[What Users Can Expect]

  • Maintain a clear mind by separating price action from cycle progression. Even when the main chart is cluttered, the sub-window provides a clean view of the current phase.
  • Identify high-probability setups by spotting confluences where the colors of Mid, Long, and Max cycles align.

Summary

Indicator profile

Discussion

Customer reviews

0.0
Reviews: 0
Customer reviews
No reviews for this product yet. Already tried it? Be the first to tell others!

FAQ

Bollinger Bands
AI-assisted
BOS
ATR
Triangle
CCI
Support & Resistance
Products available through cTrader Store, including trading bots, indicators and plugins, are provided by third-party developers and made available for informational and technical access purposes only. cTrader Store is not a broker and does not provide investment advice, personal recommendations or any guarantee of future performance.

You may also like

Indicator
AI-assisted
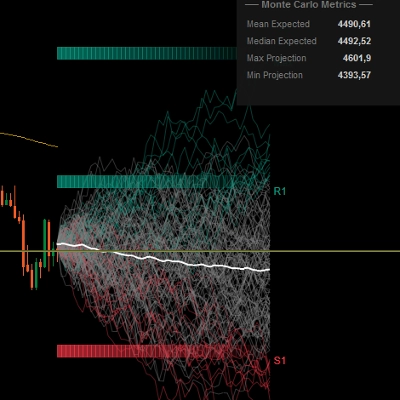
Predictive Monte Carlo Engine Forecast future price paths using institutional-grade statistical models and probability
Indicator
VWAP
Volume
+5
Multi VWAP. Three timeframes. One clean chart. Your Essential Trading Tool.
Indicator
Candlestick pattern detector lite version
Indicator
Market Sessions
Indicator
ATR
Prop
+16
Inside Bars • Outside Bars • Strong Bars • Round Numbers • Smart EMA Momentum
Indicator
AI
ATR
+12
The standard Relative Strength Index (RSI), RSI & Signal Cloud, Smart Volatility Filter (ATR), On-Chart Info Dashboard
Indicator
AI
SMC
+13
Dynamic Liquidity Depth exposes hidden volume
Indicator
RSI
MACD
+5
LudwigICT – Digital Root & IDR (cTrader Automate)
Indicator
SMC
Forex
+5
MMXM Structure by LudwigICT – Professional Market Structure Mapping Tool
Indicator
VWAP
Support & Resistance
Trading.FC$_vwap Algo shows VWAP trends, dynamic support/resistance and deviation bands to spot potential trade entries.
Indicator
VWAP
Volume
+4
Advanced Order Flow & Volume Profiling for cTrader. Unveil institutional footprints, Delta, and Anchored VWAPs.
Indicator
Volume
Key Levels
+1
Session volume profiles from tick volume: POC, value area high and low, and naked POCs extended until touched.
Indicator
SMC
Prop
+5
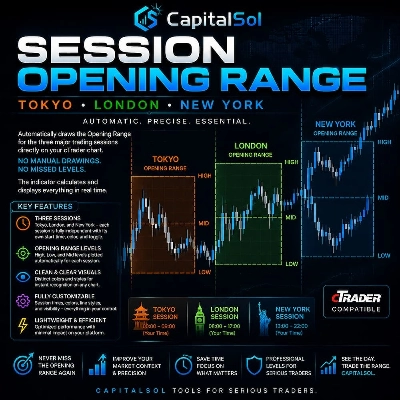
Automatically draws the Opening Range (High & Low) for Tokyo, London, and New York sessions. Configurable start times,
Indicator
Order Block
Order blocks confirmed by BOS, displacement and FVG, plus up to 3 higher-timeframe levels on one chart. No repaint
Indicator
BOS
EMA
+5
VWAP Bands indicator with 3 standard deviation levels, buy/sell zones, and a draggable ON/OFF button to toggle the entir
Indicator
RSI
VegaXLR's cTrader StochRSI identifies overbought/oversold RSI levels for precise trade entries.
Indicator
ATR
RSI
+18
Breakout SMA by SLA is a trend-filtering tool designed to enhance the ORB SLA framework.
Indicator
BOS
CHOCH
+5
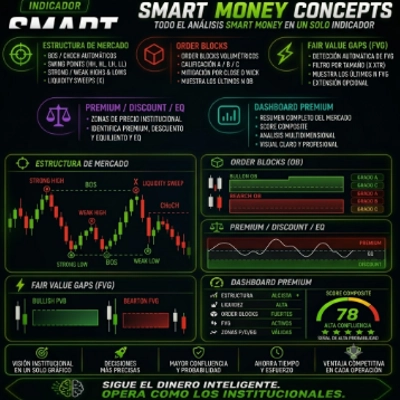
Smart Money Concepts Automate your institutional analysis and make decisions with pinpoint precision..

Price

Since 16/03/2026