
Description
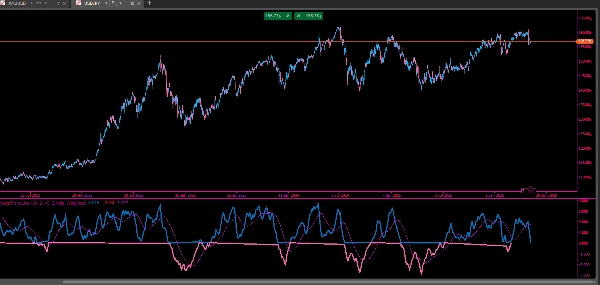
This indicator is a modified version of the Fisher Transform designed for cTrader. It converts price data into a normalized oscillator that highlights potential turning points in the market.
It calculates a smoothed Fisher Transform based on the midpoint price (average of high and low) over a configurable period. The transformation emphasizes extreme price movements, making tops and bottoms easier to identify.
To reduce noise, the raw Fisher values are further smoothed using two moving averages with configurable periods and types. The indicator also separates positive and negative Fisher values into two differently colored plots (green and red), improving visual clarity around the zero line.
Additionally, a signal line (yellow) is plotted using the second moving average, helping traders identify trend direction and momentum shifts more clearly.
Overall, this indicator is used to detect reversals, highlight overbought/oversold conditions, and provide smoother trend confirmation through layered averaging.
Summary
To reduce noise, the indicator applies two moving averages with customizable periods and types to smooth the raw Fisher values. It visually separates positive and negative Fisher values into green and red plots, respectively, enhancing clarity around the zero line. Additionally, a yellow signal line derived from the second moving average helps identify trend direction and momentum shifts.
This indicator is primarily used to detect market reversals, highlight overbought and oversold conditions, and provide smoother trend confirmation through layered averaging. It supports trend and market structure analysis and outputs visual signals suitable for bar-based price data.