
Multi-Timeframe Bias Assistant
Indicator
Version 1.0, Jun 2026
Windows, Mac
Description
Multi-timeframe Period Overlay and MTF Bias Indicator Overview
The MTF Period Overlay and Bias assistant is a comprehensive, multi-timeframe (MTF) overlay indicator built for cTrader. It is designed to aggregate high-level market structure, session liquidity, and risk management metrics directly onto lower-timeframe execution charts (M1–M15), minimising the need to constantly switch between chart tabs.
Market Data & Conditions Analysed
The indicator evaluates confluence across several core price action metrics:
- Multi-Timeframe Bias: Evaluates directional bias (Bullish, Bearish, or Ranging) across the Daily, H4, H1, and M15 timeframes simultaneously.
- Supply & Demand (S&D): Automatically detects valid swing points, impulsive moves, and base candles to draw Supply and Demand zones. It actively filters for Fair Value Gaps (FVGs) to validate these zones.
- Premium vs. Discount Pricing: Calculates the Daily midpoint (Equilibrium or EQ) to determine if current price action is in a Premium (expensive) or Discount (cheap) territory.
- Volatility & Risk Capacity: Tracks the Daily Average True Range (ATR) to measure how much of the typical daily movement has already been consumed, ensuring trades aren't taken in an exhausted market.
Visual Elements & Interpretation
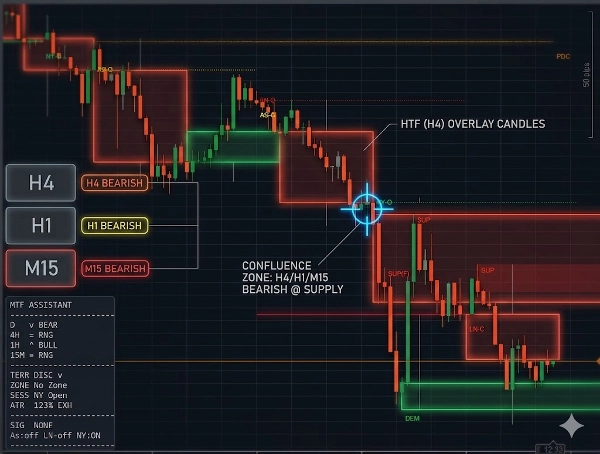
- HTF Candle Overlay (New in v2.19): Renders transparent, wide Higher Timeframe candles (e.g., H1 or H4) directly over your M1-M15 charts. The real-time "live" block stretches as lower timeframe bars close, allowing you to see exactly how current micro-price action is shaping the higher timeframe candle.
- S&D Zone Boxes: Visual rectangles marking valid zones. These are labelled dynamically, tracking how many times the zone has been tested (e.g., "Chart DEM-F" for a fresh demand zone, or "DEM 1x" for a retested zone).
- The Bias Table: A customizable, color-coded on-screen dashboard summarizing the trend across D1, H4, H1, and M15, making it instantly clear if the market is aligned.
- Trade Signals: Displays distinct colour-coded buy/sell signals when stringent conditions are met (e.g., price is in a Discount zone, touching a Fresh Demand level, forms an engulfing or pin bar pattern, aligns with MTF bias, and falls within an active trading session with available ATR).
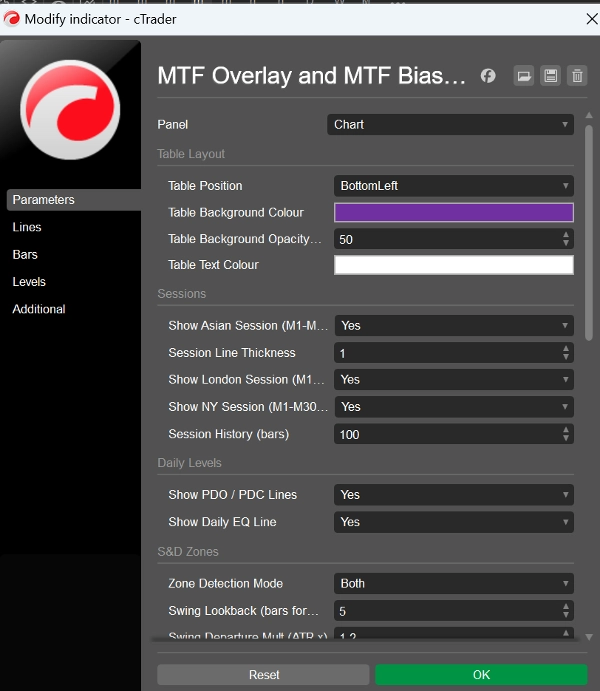
- Session & Daily Levels: Draws vertical lines for Asian, London, and NY session opens, alongside horizontal lines for the Previous Daily Open (PDO), Previous Daily Close (PDC), and Daily Equilibrium.
Key Settings & Parameters
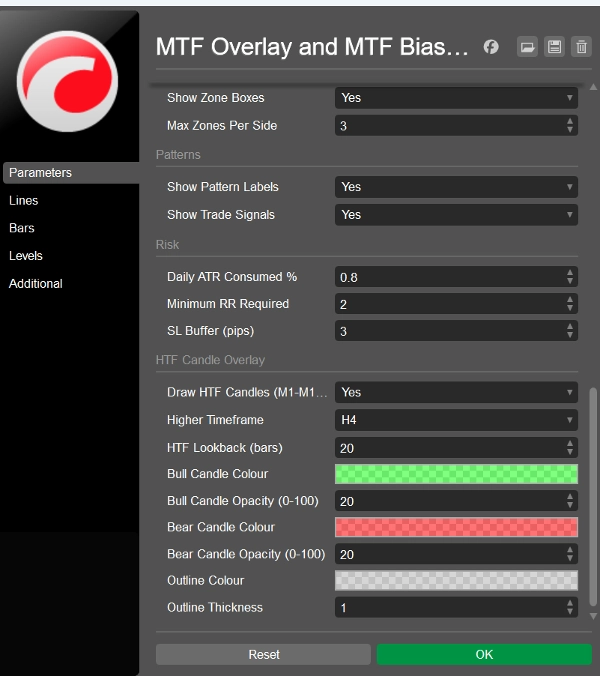
- HTF Candle Overlay:
DrawHtfCandles,HtfTimeframe(H1/H4/D1), and highly customizable opacity/colour settings to prevent chart clutter. - S&D Zones:
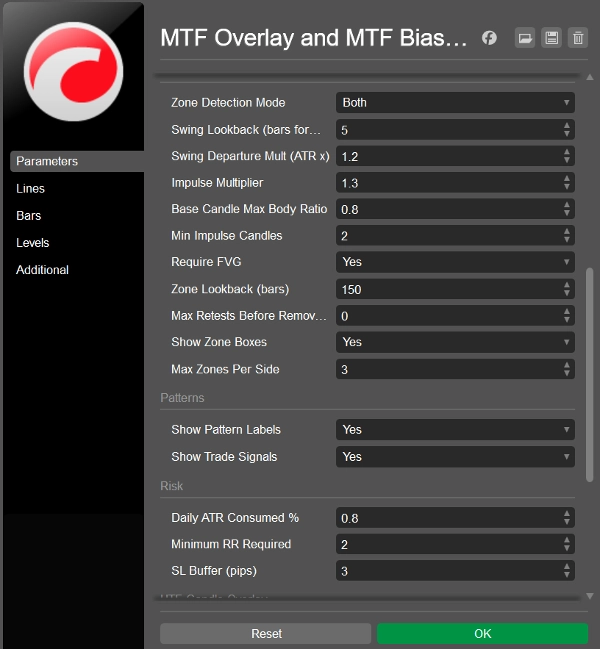
RequireFVG(toggles strict structural rules),Max Retests Before Remove(clears broken zones to keep charts clean), andImpulse Multiplier(dictates how aggressive a move must be to qualify as a zone). - Risk Management:
Daily ATR Consumed %(caps trading if, for example, 80% of the daily range is already met) andMinimum RR Required(ensures trade parameters meet a baseline risk-to-reward ratio).
Typical Use Cases & Scenarios
This tool is built for high-probability, intraday trend continuation setups.
- The "Aligned Pullback" Scenario: A trader observes that the D1, H4, and H1 biases are all Bullish. They switch to the M15 chart. The indicator flags that price has dropped into the "Discount" half of the daily range and touches a fresh H1 Demand zone. As the London session opens, a bullish engulfing candle forms. The indicator validates the ATR limits and triggers a Buy signal, confirming a high-confluence entry.
Best Suited For
- Trader Profile: Intraday day traders and scalpers utilising Supply and Demand methodologies with price action. It perfectly complements strategies focused on Order Blocks, liquidity sweeps, and multi-timeframe alignment.
- Experience Level: Intermediate to Advanced. Beginners may be overwhelmed by the density of information (FVGs, Premium/Discount, MTF bias).
- Specific Environments: Traders executing on Gold (XAU/USD) or volatile indices, particularly those operating within the strict drawdown parameters of proprietary trading firm evaluations, where the built-in ATR exhaustion and minimum RR filters are critical for capital preservation.
Important Limitations & Usage Notes
- Chart Specificity: The HTF candle overlay and specific S&D zones are strictly gated to M1–M15 charts. Applying the indicator to an M30 chart or higher will suppress the overlay to prevent visual distortion.
- Lagging Bias: The higher timeframe bias (D1, H4) relies on closed candles. In highly volatile or news-driven environments, the bias may take time to flip, meaning the indicator could label an aggressive reversal as "Ranging" until the larger candle closes.
- Not an Auto-Bot: The trade signals are alerts for high-confluence conditions, not guaranteed execution mandates. Discretion is required to evaluate fundamental drivers and macro-economic context.
Summary
Indicator profile
Indicator category
Market structure (SMC)
Output type
Visualisation
Data requirements
Bars only
Tick data
Supported signals
Reversal
Level touch
Customer reviews
0.0
Reviews: 0
Customer reviews
No reviews for this product yet. Already tried it? Be the first to tell others!
Discussion
FAQ
Fair Value Gap
Liquidity Sweep
Order Block
Market Structure
Supply & Demand
Products available through cTrader Store, including trading bots, indicators and plugins, are provided by third-party developers and made available for informational and technical access purposes only. cTrader Store is not a broker and does not provide investment advice, personal recommendations or any guarantee of future performance.
More from this author


Price
97.77M
Traded volume
16.77K
Pips won