present
Sign up and get $50 off your first purchase
Trading product for Raf Volume Profile Pro v3.0 Indicator EMA Breaker Block, image 1
Raf Volume Profile Pro v3.0
Indicator
Version 1.0, Sep 2026
Windows, Mac
5.0
Reviews: 1
Trading product for Raf Volume Profile Pro v3.0 Indicator EMA Breaker Block, image 2
Trading product for Raf Volume Profile Pro v3.0 Indicator EMA Breaker Block, image 3
Trading product for Raf Volume Profile Pro v3.0 Indicator EMA Breaker Block, image 4
Trading product for Raf Volume Profile Pro v3.0 Indicator EMA Breaker Block, image 5
Trading product for Raf Volume Profile Pro v3.0 Indicator EMA Breaker Block, image 6
Since 09/06/2026
4
Sales

Description

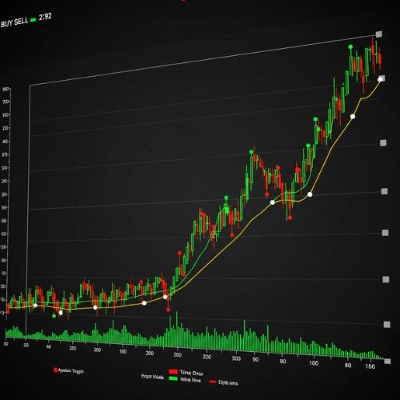
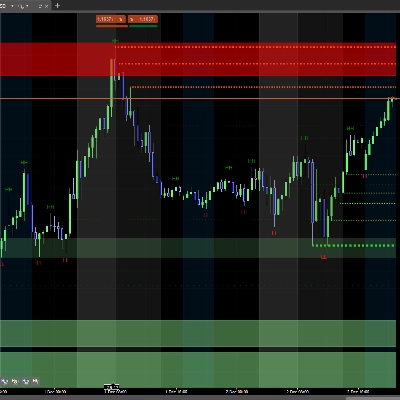
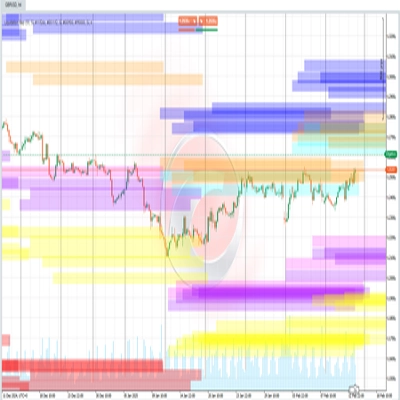
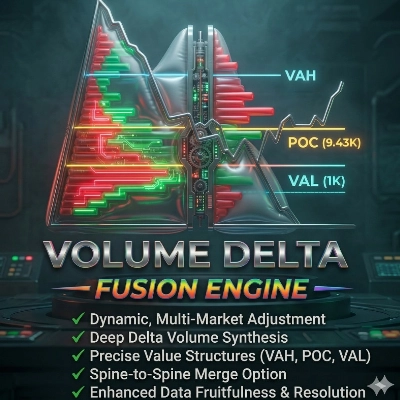
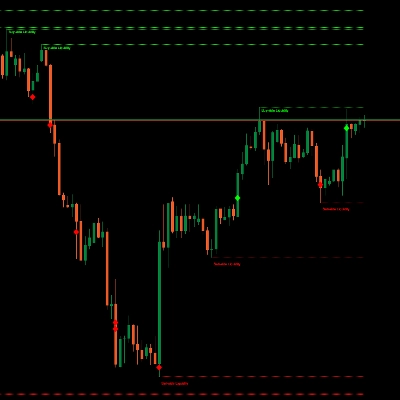
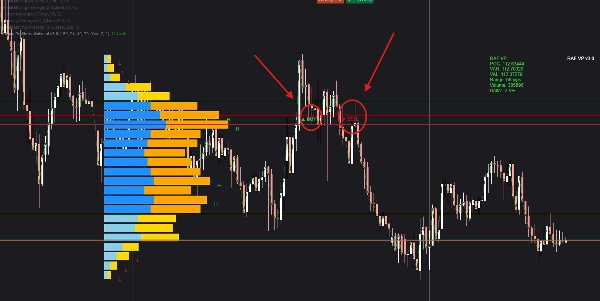
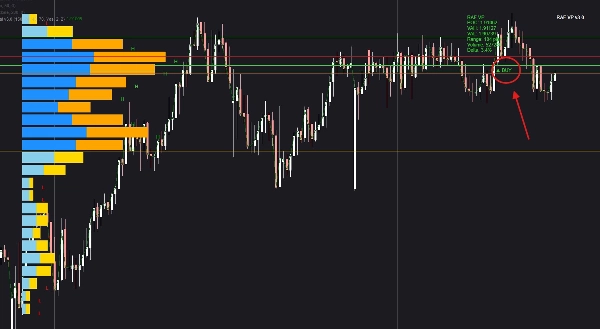
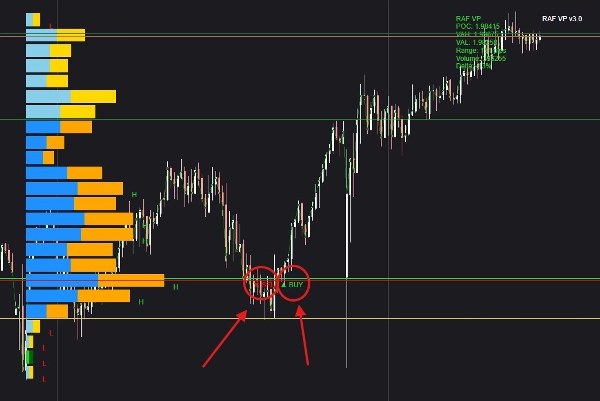
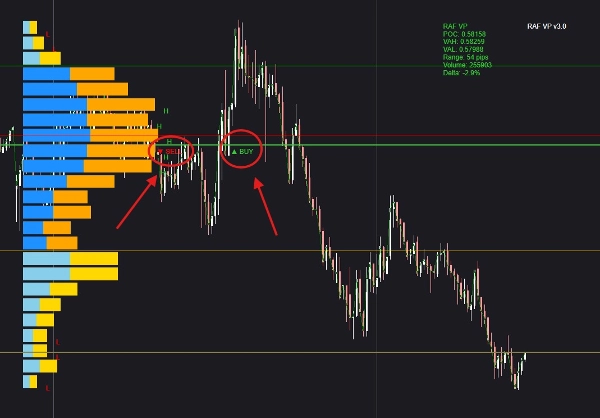
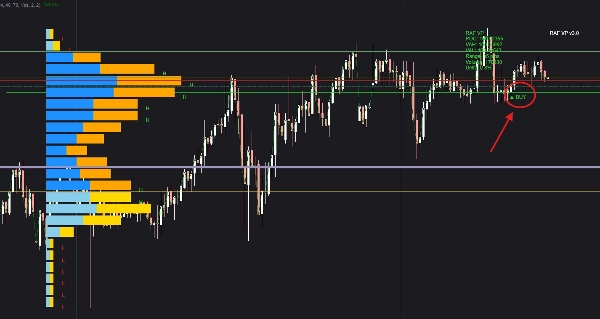
It analyses every candle to map where trading volume is concentrated, revealing the real zones where institutional traders are active. A live volume profile shows HVN areas where price is likely to stall and LVN areas where it can break quickly. Delta tracking exposes whether buyers or sellers are gaining strength inside each candle. When price interacts with the POC, imbalance zones, or key volume shelves, the system evaluates order‑flow behaviour and generates BUY or SELL signals based on shifts in market control. The built‑in info window displays live POC, delta, volume levels, and signal conditions so traders can instantly see why a setup is forming and how strong it is. This helps identify reversals, continuation setups, and high‑probability entries with far greater accuracy than standard indicators.

Summary

AI summary
Raf Volume Profile Pro v3.0 is an advanced volume-profile indicator designed to analyze each candle's trading volume distribution, highlighting zones of institutional activity. It identifies High Volume Nodes (HVN) where price tends to stall and Low Volume Nodes (LVN) where price can move rapidly. The tool tracks delta within candles to determine whether buyers or sellers are gaining strength. When price interacts with the Point of Control (POC), imbalance zones, or key volume shelves, the indicator assesses order flow and generates buy or sell signals based on shifts in market control. A built-in info window displays live POC, delta, volume levels, and signal conditions, providing real-time insight into the strength and formation of setups. This functionality supports identifying reversals, continuation patterns, and high-probability trade entries with greater precision than standard indicators. The product integrates concepts such as exponential moving averages (EMA), breaker blocks, key levels, imbalances, and support/resistance within its volume-based analysis framework. It outputs actionable signals including level touches, breaks, reversals, breakouts, and trend strength, relying on volume data as its primary input.
Indicator profile
Indicator category
Volume
Output type
Signals
Data requirements
Volume
Supported signals
Level touch
Level break
Reversal
Breakout
Trend strength

Customer reviews

5.0
Reviews: 1
5
100 %
4
0 %
3
0 %
2
0 %
1
0 %
Customer reviews
October 4, 2026
Raf Volume Profile Pro v3.0 provides clear volume histograms, POC and Value Area levels, Delta statistics, and BUY/SELL markers. Tested on EURUSD H1 and XAUUSD H1/M1, the indicator displayed consistently with a useful statistics panel. The layout is generally readable, although the profile can occupy part of the chart. A practical addition for discretionary volume analysis.

Discussion

FAQ

EMA
Breaker Block
Key Levels
Imbalance
Volume
Support & Resistance
Products available through cTrader Store, including trading bots, indicators and plugins, are provided by third-party developers and made available for informational and technical access purposes only. cTrader Store is not a broker and does not provide investment advice, personal recommendations or any guarantee of future performance.

More from this author

Indicator
Supply & Demand
Support & Resistance
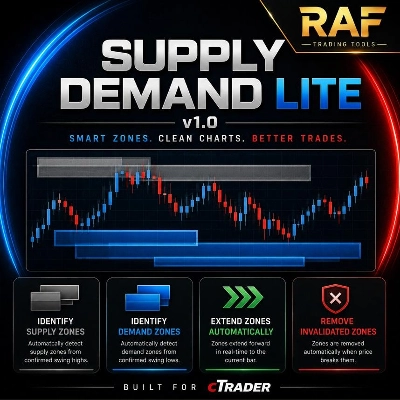
RAF Supply Demand Lite v1.0 automatically detects clean Supply and Demand zones using confirmed swing highs and lows. Zo
cBot
EMA
MACD
+5
A disciplined MACD‑EMA trading bot with smart protection, timed SL control, and reliable automated trade execution.
1
Profit factor

You may also like

Indicator
Signal
Scalping
Average accuracy of around 60% to 70% on 45min timeframes it is highly recommended to use stop losses
Indicator
Risk Dashboard
AI-powered daily range forecasts help traders spot volatility opportunities and plan stops and targets.
Indicator
ATR
Wedge
+2
Strong Supertrend Turn Market Movement into a Clear Map Market analysis
Indicator
RSI
RSI on the main chart with 45/55 momentum levels, overbought/oversold levels, averaged RSI, and multi-timeframe support.
Indicator
Fair Value Gap
Liquidity Grab
+2
PRO Liquidity Sweep + FVG Combo detector with custom Gold/Blue signals & alerts
Indicator
ATR
Prop
+15
Initial Range – Where the open writes the script.
Indicator
Prop
Forex
+11
⚡Nebula Range Filter is a professional trend filter indicator for cTrader⚡
Indicator
Forex
Crypto
+5
ICT Order Block Advanced
Indicator
RSI
Breakout
+1
📊 Liquidation Map: Potential areas where highly leveraged investors might face liquidations.
Indicator
Volume
Order Block
+4
Advanced Pro Volume Profile: Double Back-to-Back, Institutional Dynamic, Fixed Range & Order Flow
Indicator
ATR
Prop
+6
🟢 Strength-ranked S/R zones with MTF levels and Pro labels. Nearest-zone band and HUD for faster, cleaner entries. 🔴
Indicator
Forex
BTCUSD
+4
🚀 HALF TREND Indicator - The Ultimate Trend Following System 🚀
Indicator
Forex
Crypto
+2
PREMIUN INDICATOR
Indicator
Prop
Forex
+11
🧭 See when your market tends to move—by Month, Day-of-Week, or Hour-of-Day🧭
Indicator
Forex
BTCUSD
+5
Buy-Side & Sell-Side Liquidity (BSL/SSL) Indicator
Indicator
AI
ATR
+27
The Professional “All-in-One” Trading Suite (buy and sell indicator)
Indicator
EMA
RSI
+4
🚀📈 Plot buy/sell signals on Range Bars using Moving Averages and RSI. Clear, actionable trading insights.🚀📈
Indicator
EMA
MACD
+5
Multi-timeframe MACD with color-changing line, 4-color histogram & triangle signals.

Price

Since 09/06/2026
4
Sales