present
Sign up and get $50 off your first purchase
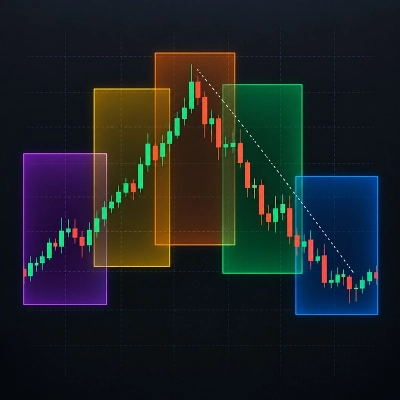
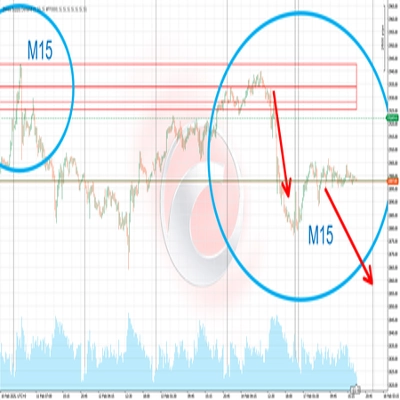
Trading product for Trend Sell Buy Indicator Moving Average, image 2
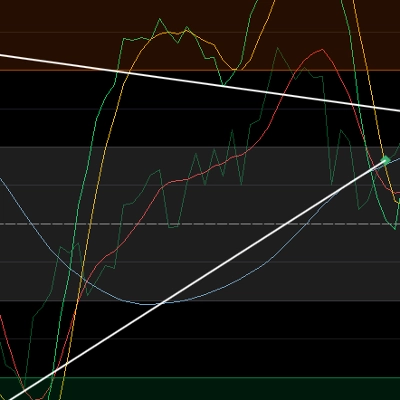
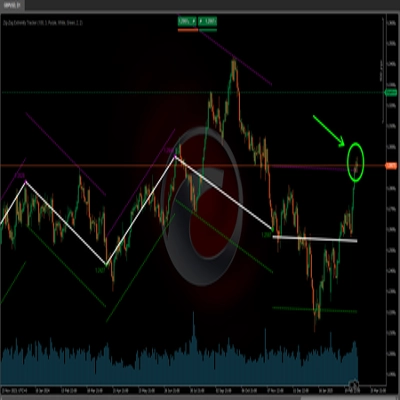
Trading product for Trend Sell Buy Indicator Moving Average, image 3
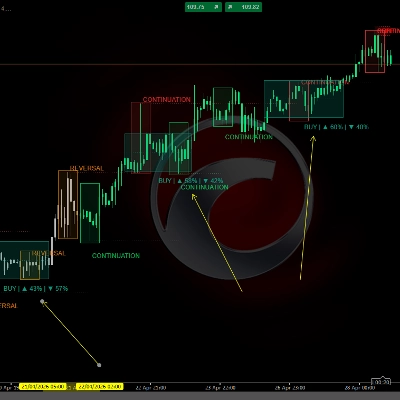
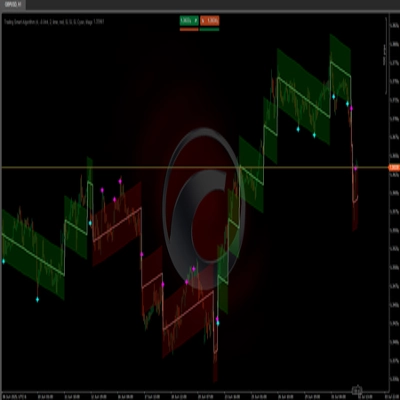
Trading product for Trend Sell Buy Indicator Moving Average, image 4
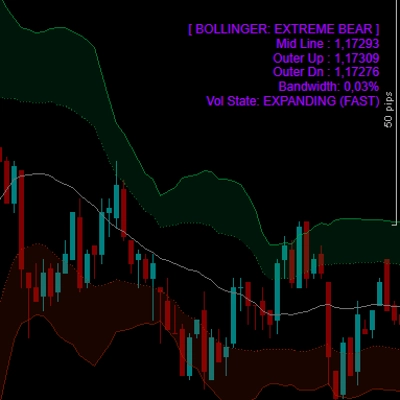
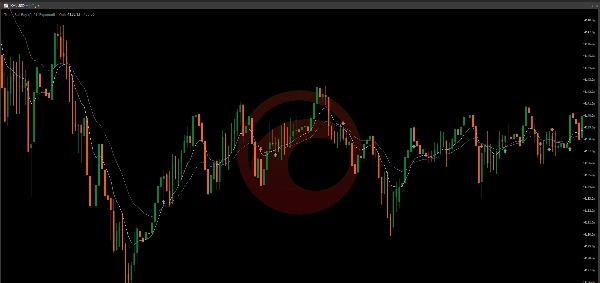
Trading product for Trend Sell Buy Indicator Moving Average, image 5
Since 21/01/2025

Description

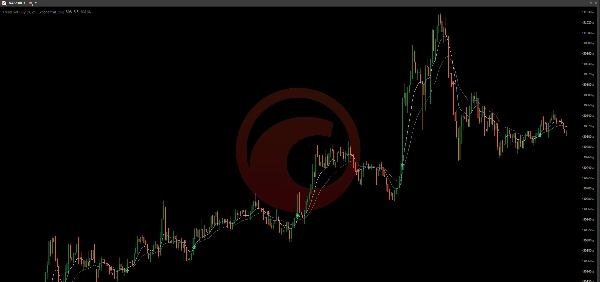
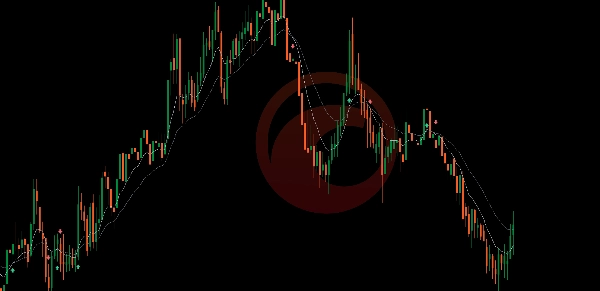
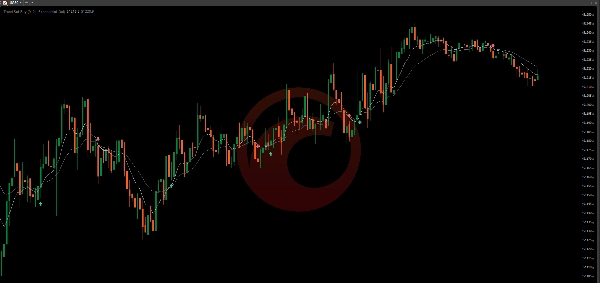
Trend Sell Buy is a lightweight trend indicator that displays potential direction changes directly on the trading chart. It analyses closing prices with a fast and a slow moving average. A green Buy arrow appears when the fast average crosses above the slow average, while a red Sell arrow appears when the fast average crosses below it.


Key settings include Fast Period, Slow Period, moving-average type and an option to hide the average lines. The default periods are 9 and 21 with exponential averages.


The indicator can be used on forex, indices, commodities and other symbols available in cTrader. It is suitable for intraday and higher chart periods and is intended for traders who want simple visual confirmation of moving-average crossovers.


Trend Sell Buy does not open, modify or close trades. Signals describe historical crossover conditions and may occur late or produce false signals in sideways markets. Always combine them with your own analysis and risk management.


Trading involves risk. Past performance does not guarantee future results.

Summary

AI summary
Trend Sell Buy is a trend indicator for cTrader that identifies potential trend changes using simple moving-average crossovers. It analyzes closing prices with two moving averagesβ€”a fast and a slow oneβ€”and marks crossover points directly on the chart. A green Buy arrow signals when the fast average crosses above the slow average, while a red Sell arrow indicates the opposite crossover. Key adjustable settings include the periods for the fast and slow averages, the type of moving average, and an option to hide the average lines. The default configuration uses exponential moving averages with periods of 9 and 21. This indicator supports various markets such as forex, indices, and commodities, and is suitable for intraday and longer timeframes. It provides visual confirmation of crossover signals but does not execute trades. Users should combine its signals with their own analysis and risk management. The indicator outputs visual signals based on historical crossover conditions.

Discussion

Customer reviews

4.0
Reviews: 1
5
0 %
4
100 %
3
0 %
2
0 %
1
0 %
Customer reviews
October 19, 2026
The 9 and 21 EMA arrows are easy to understand and the average lines can be hidden, making this a straightforward crossover display with the listing's acknowledged late and repeated signals in sideways markets.

FAQ

Moving Average
Indicator
Key Levels
Chart UI Tools
+2
Indicator
Prop
Forex
+6
Indicator
ATR
Volume
+3
Indicator
ATR
BOS
+4
Indicator
Forex
Crypto
+3
Indicator
Imbalance
Key Levels
+1
Indicator
ATR
Channel
+1
Indicator
RSI
VWAP
+5
Indicator
ATR
Volume
+2
Indicator
Forex
Indices
+5
Indicator
Volume
Order Block
+3
Indicator
Forex
BTCUSD
+5
Indicator
Indicator
Prop
Forex
+5
Indicator
SMC
Prop
+5
Indicator
ATR
RSI
+6
Indicator
BOS
CHOCH
+2
Indicator
RSI
Breakout
+1
Indicator
ATR
BTCUSD
+5

Price