Chart Overview
"Chart Overview" logo
03/09/2025
Desktop
Since 23/12/2024

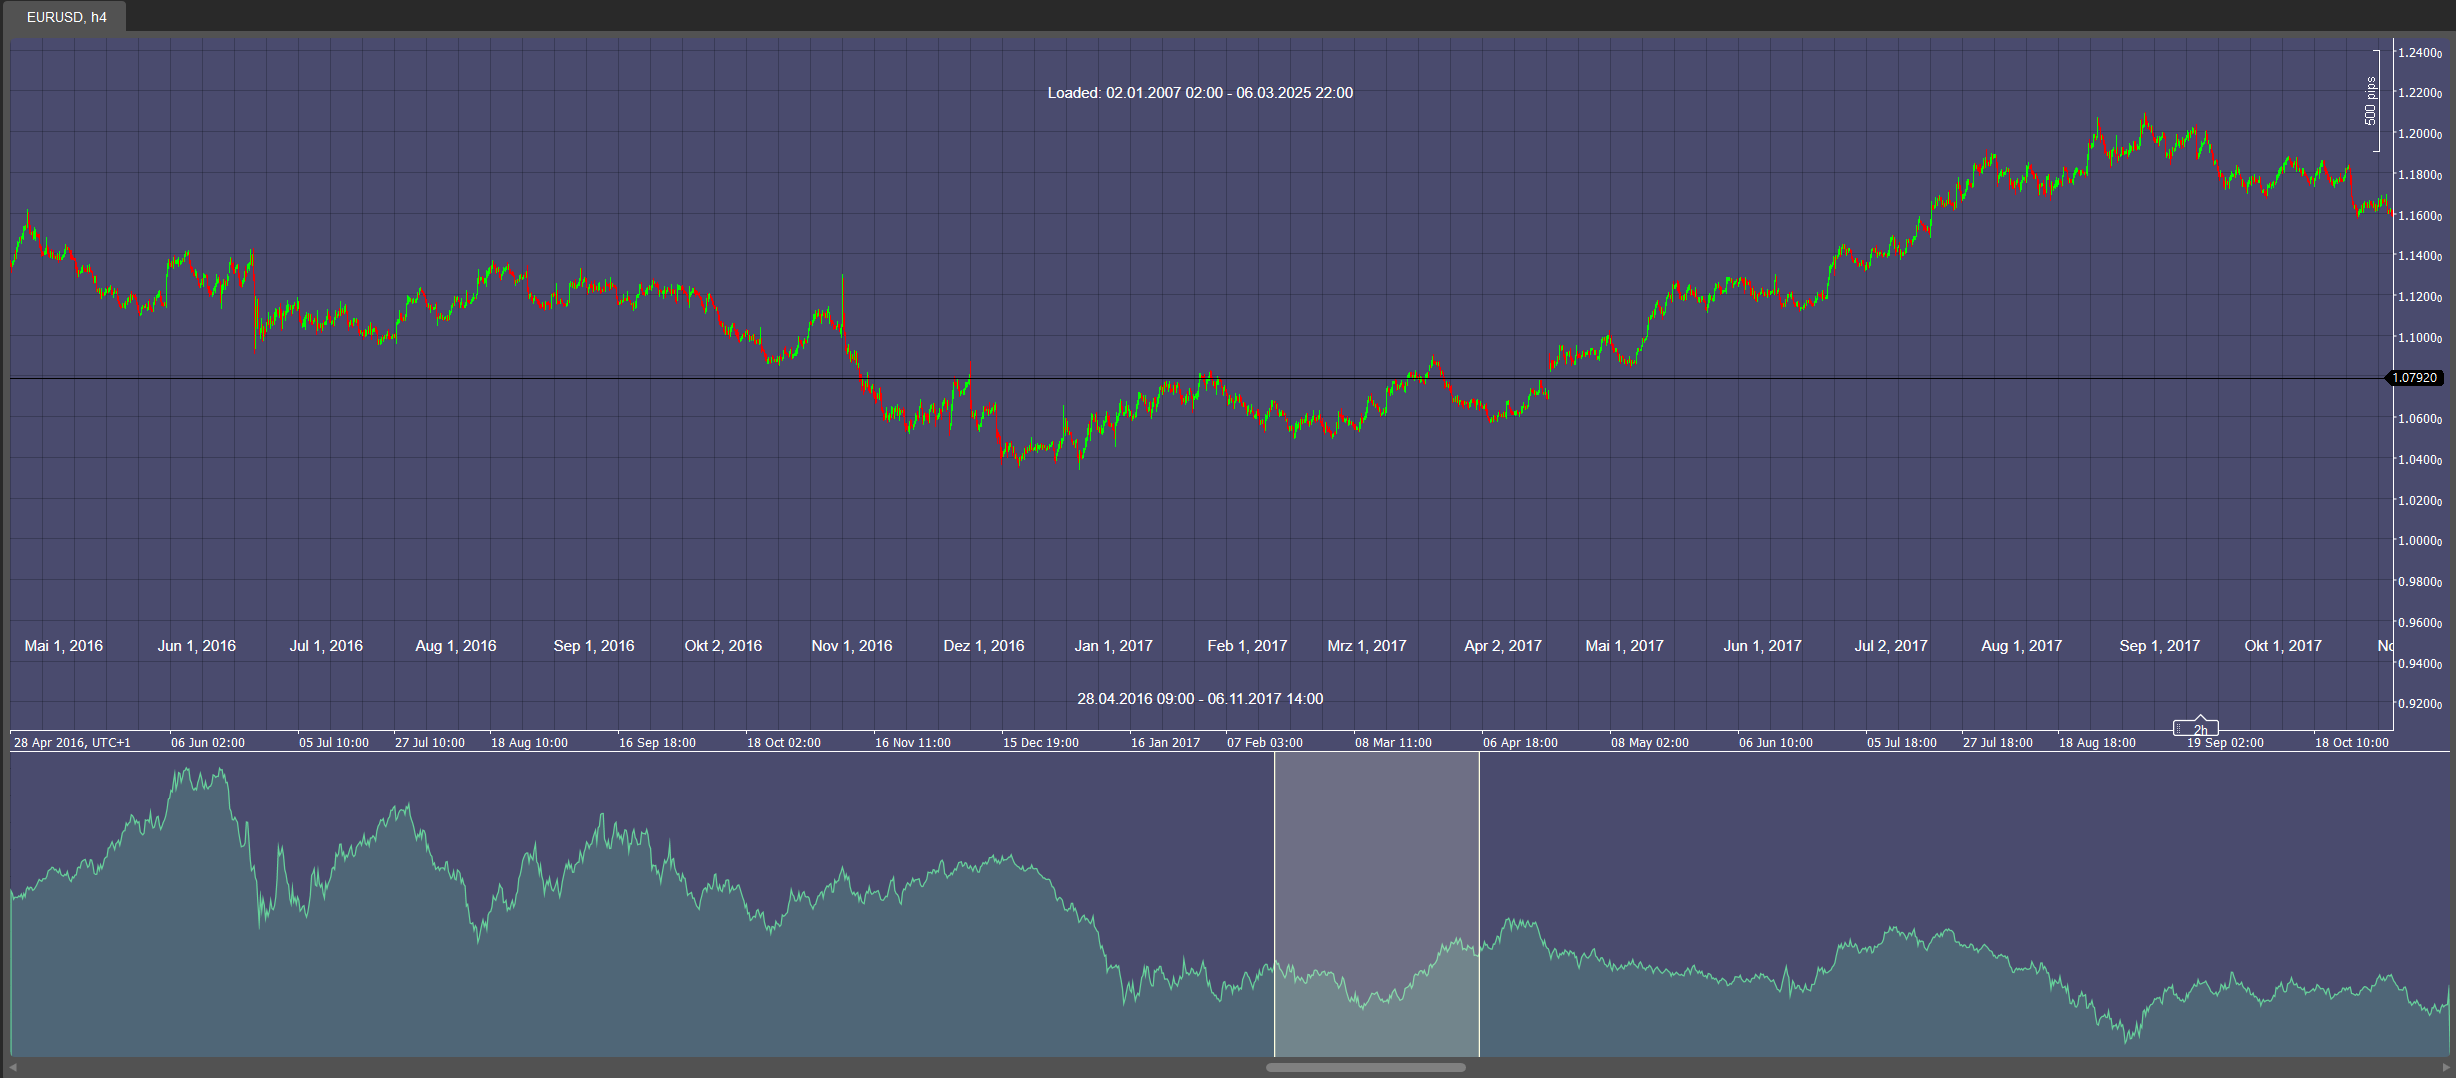
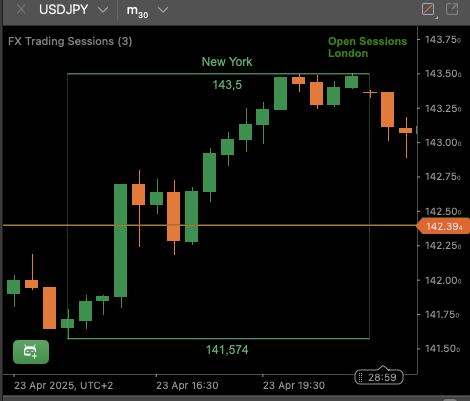
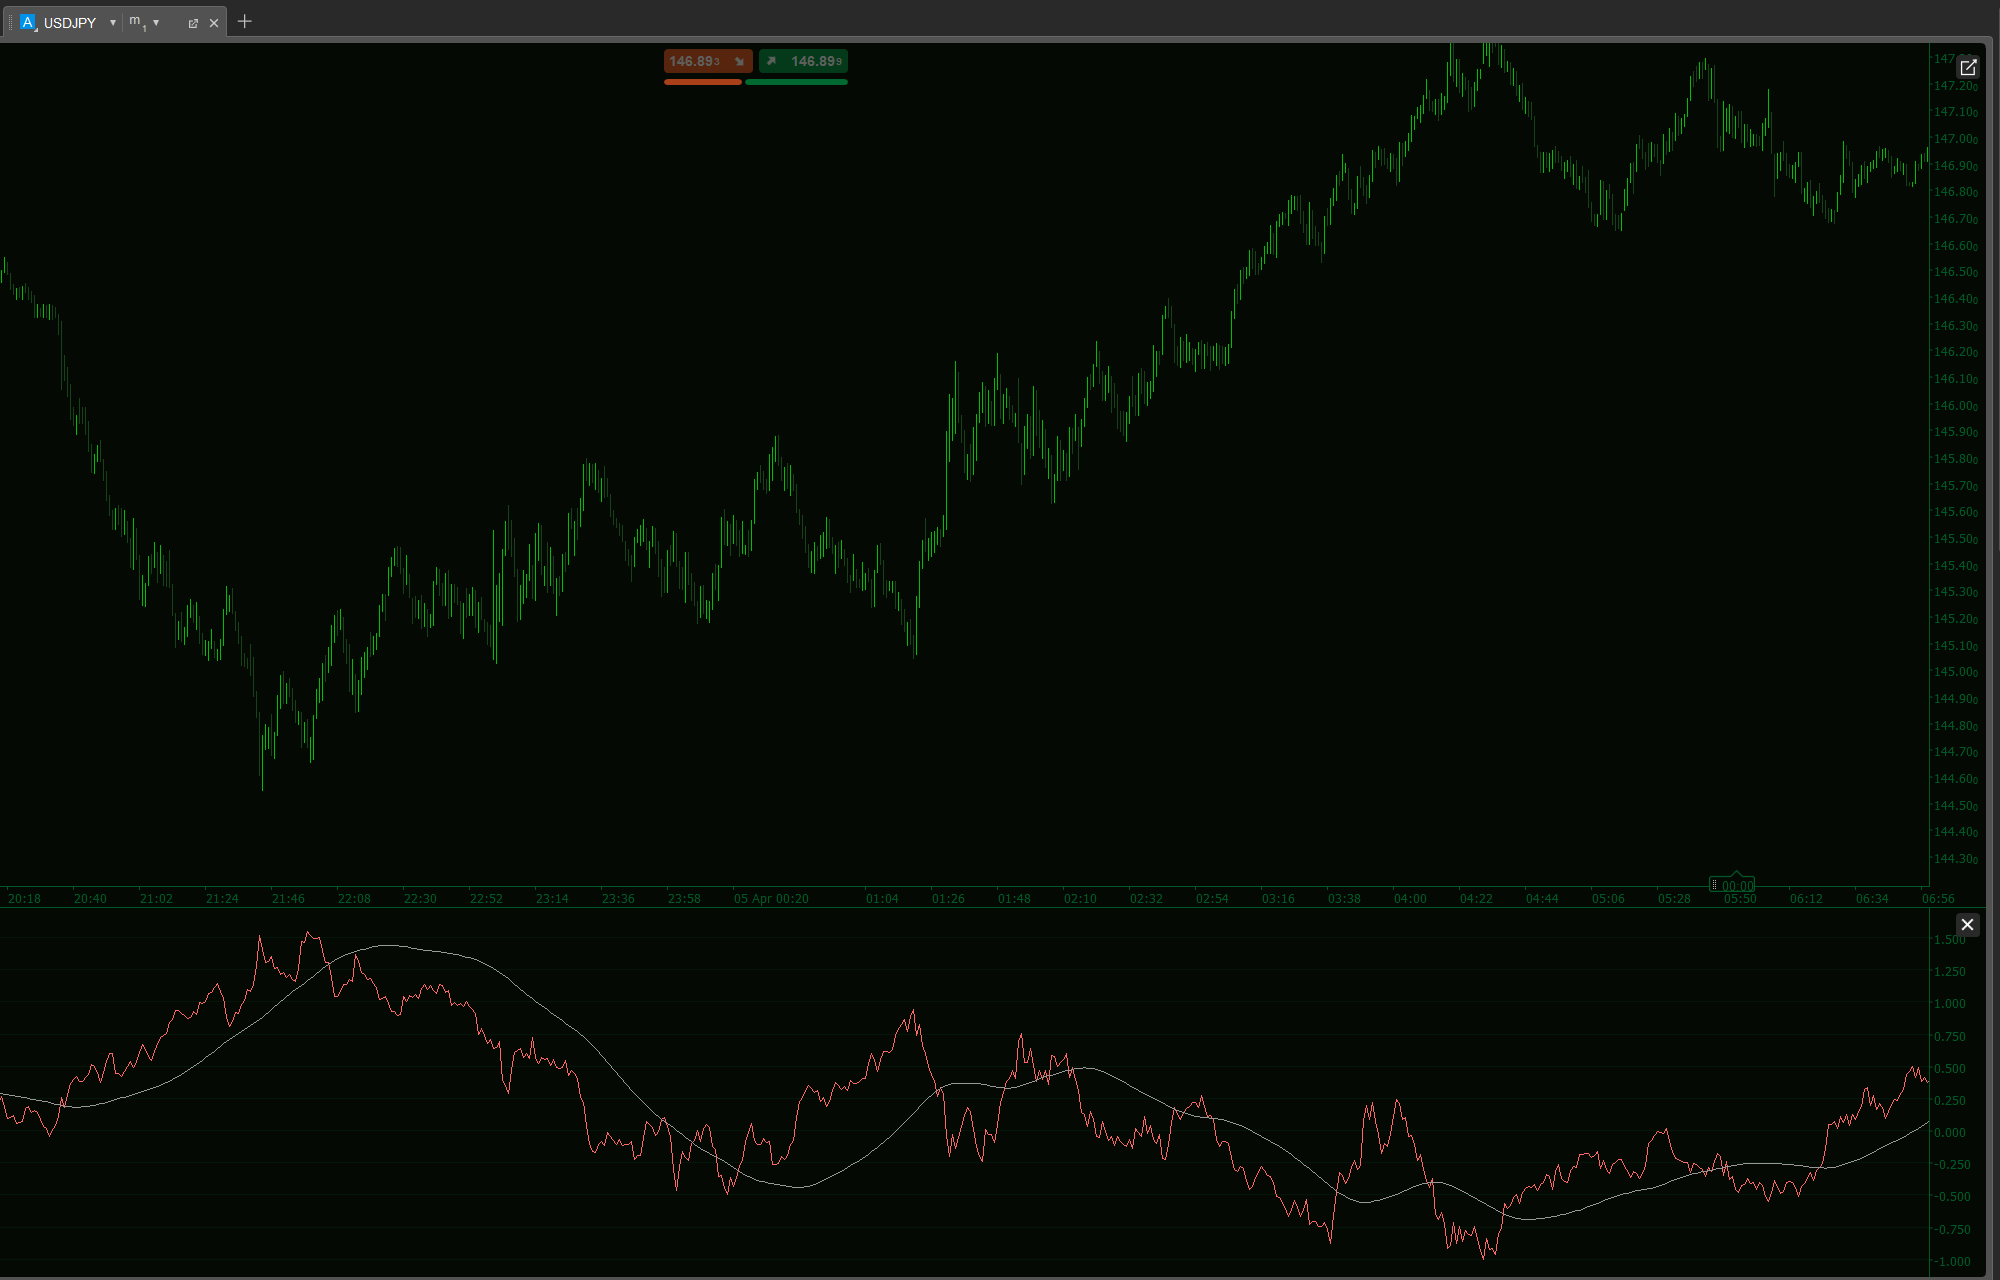
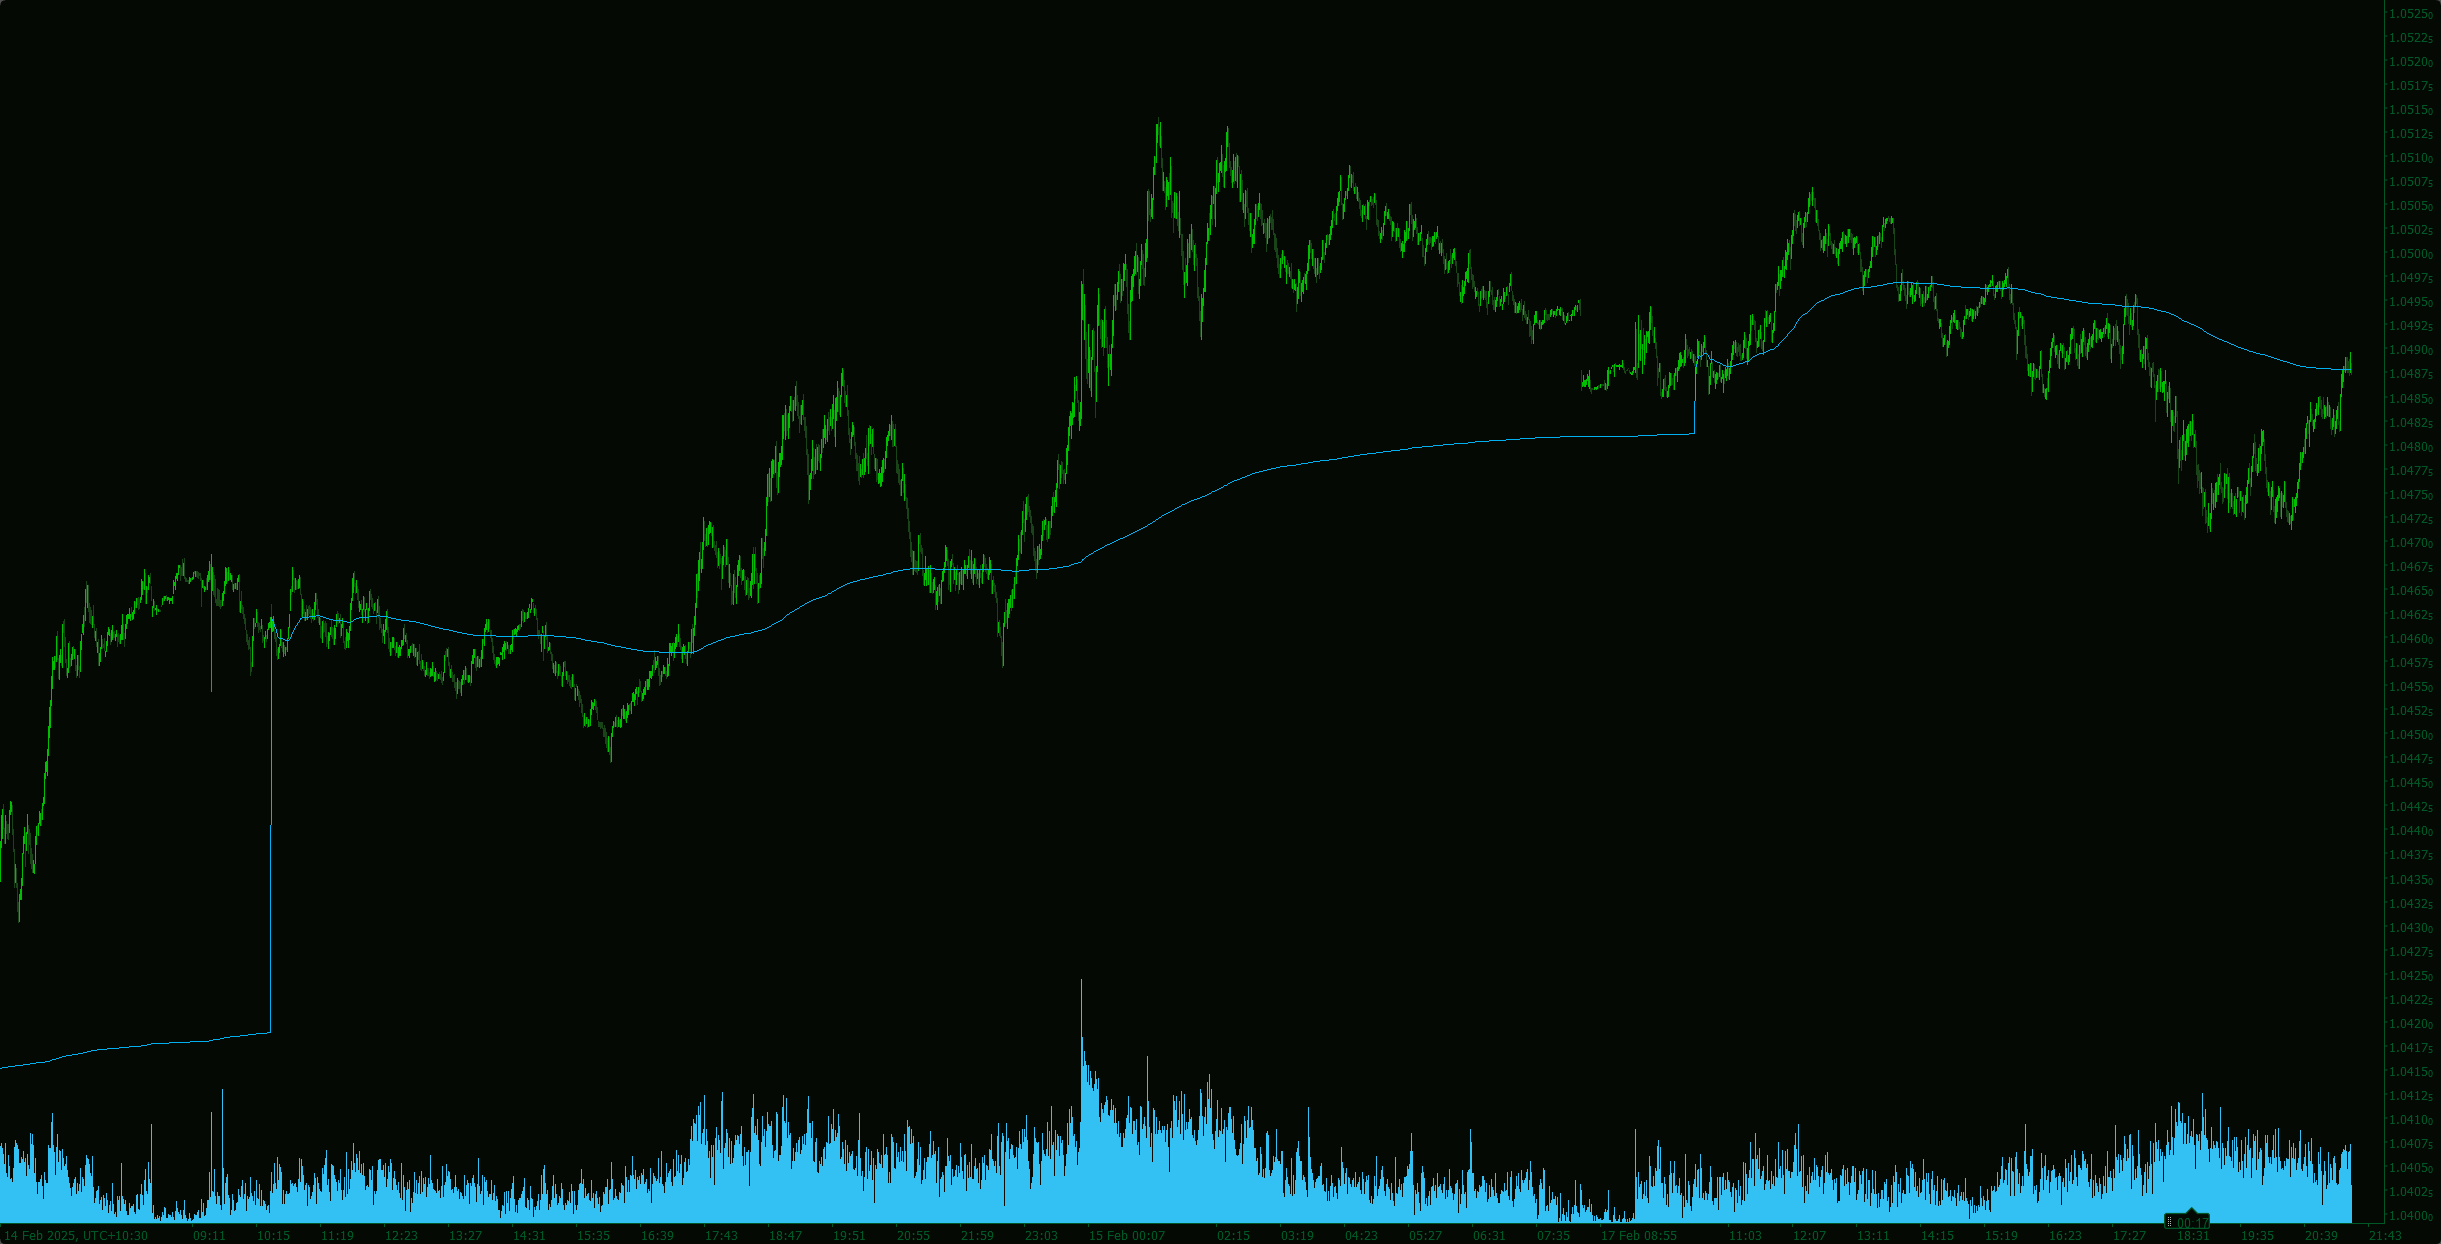
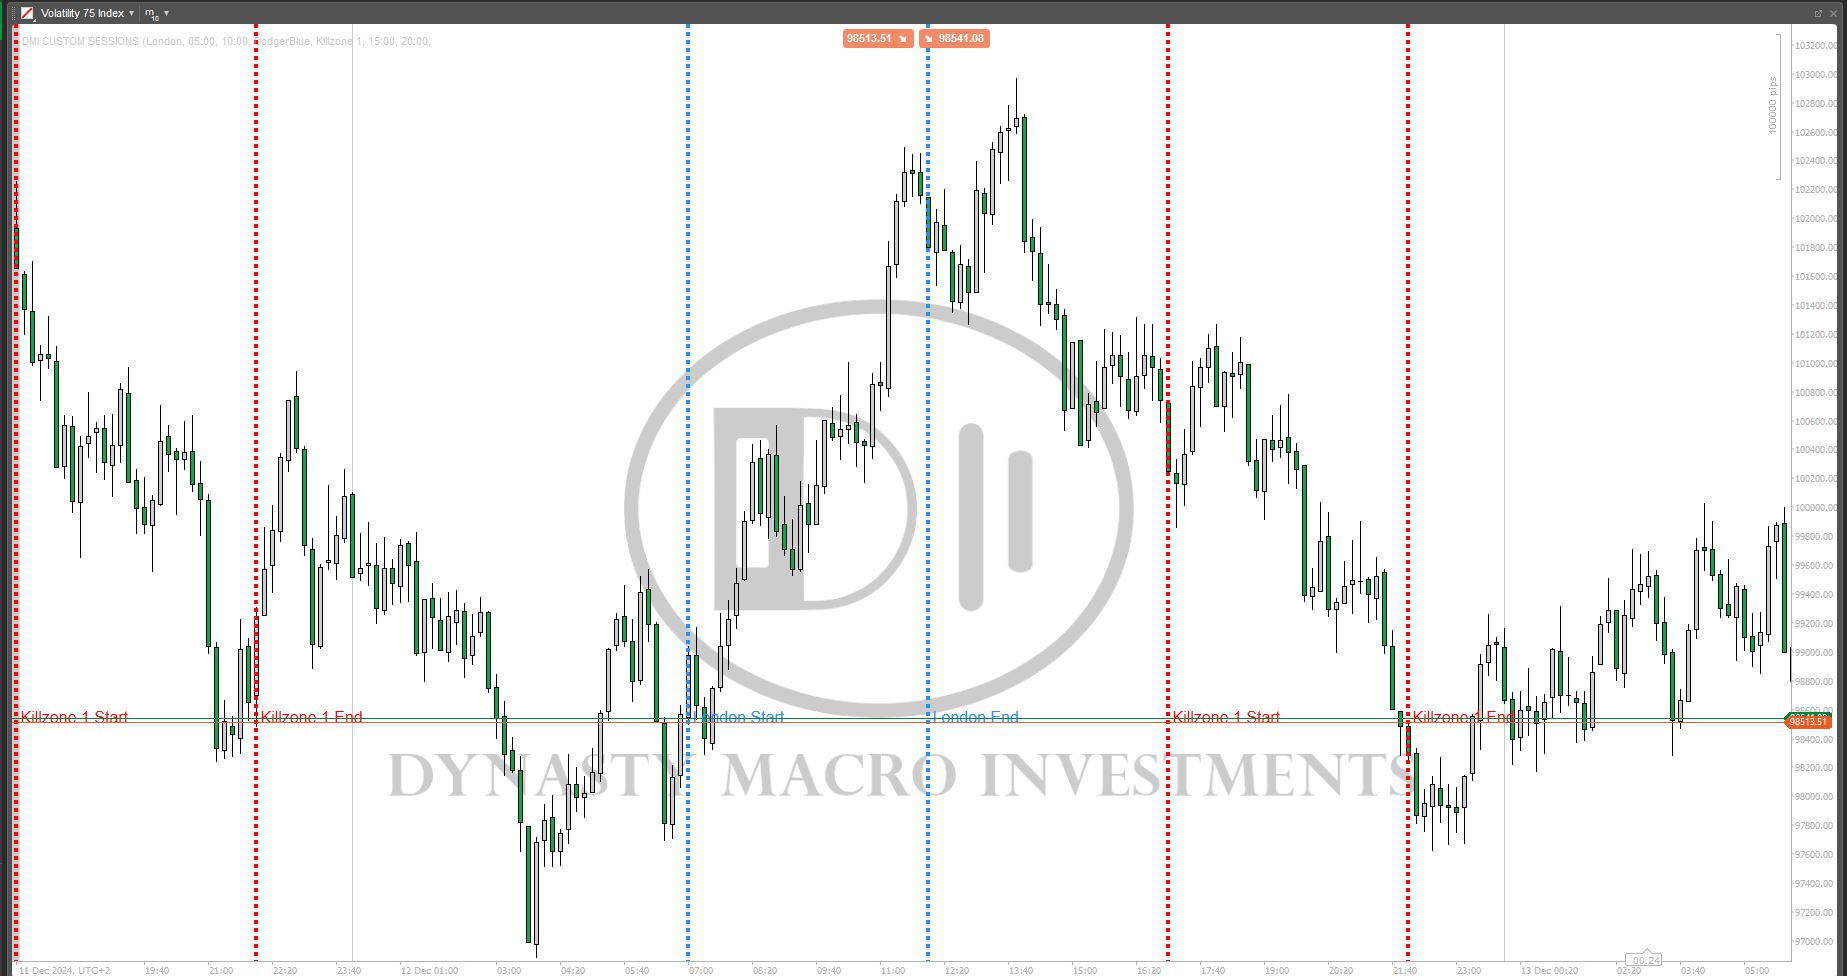
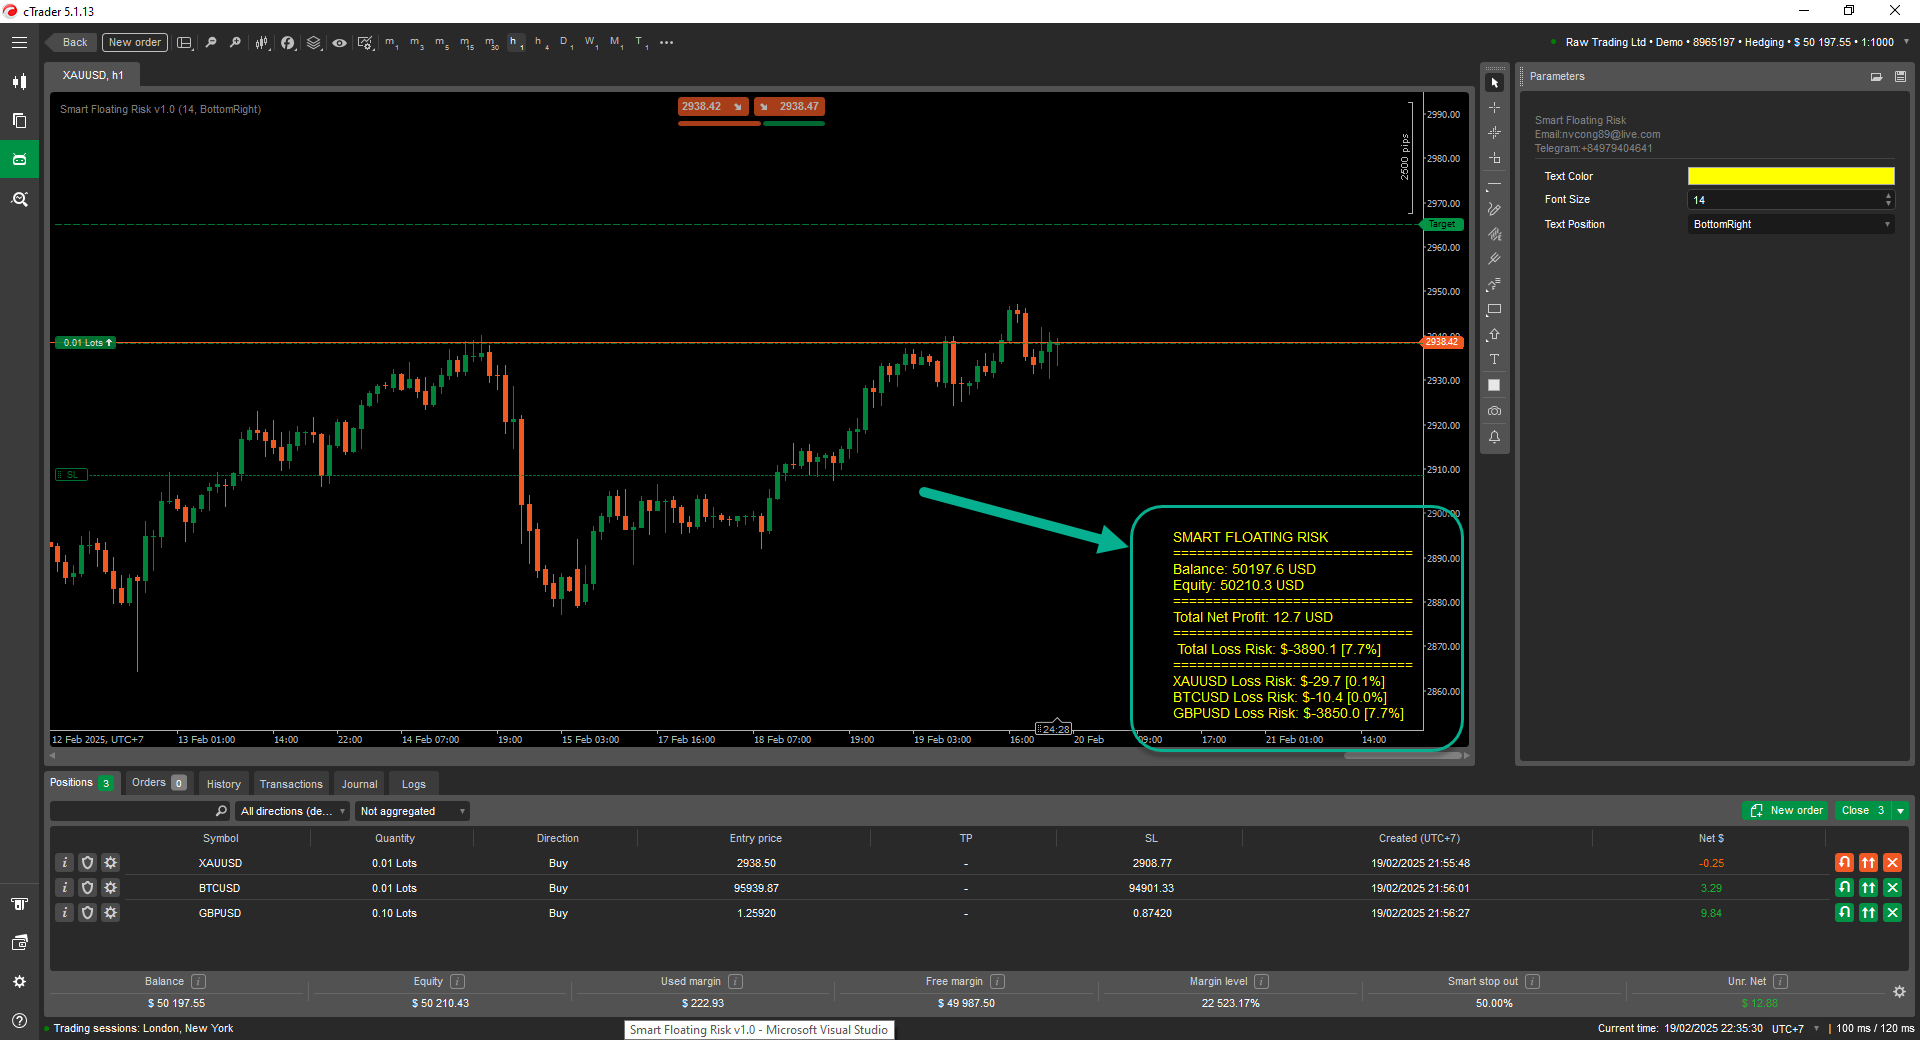
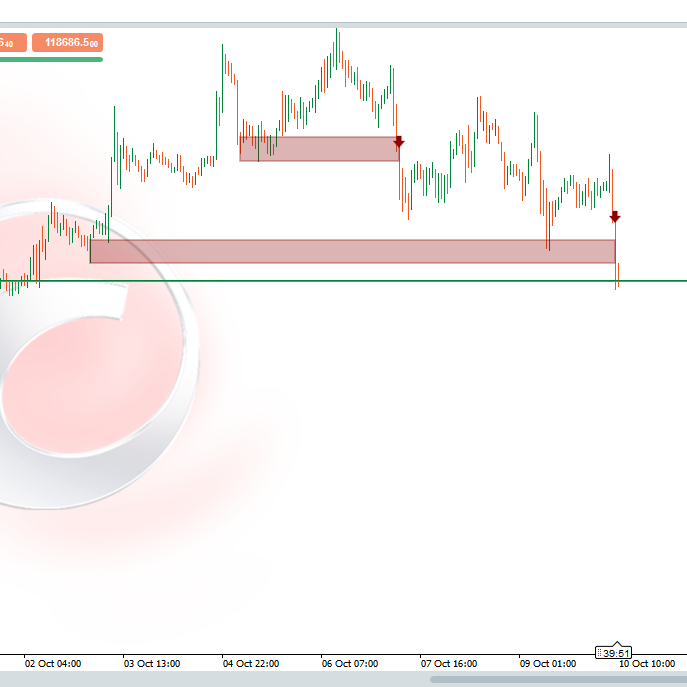
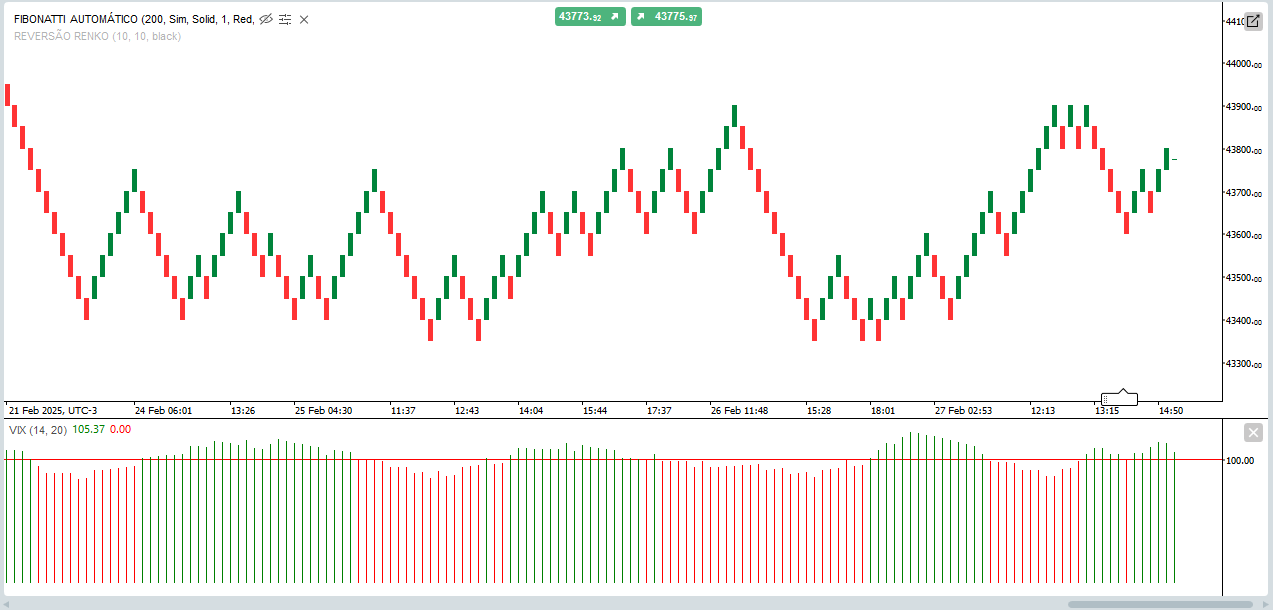
ChartOverview keeps you fully informed of the market’s entire data range, from the earliest to the latest available data point. At the top of your chart, you see a clear display of the complete loaded timeframe, while the current visible period is showcased directly on the chart for real-time insights.

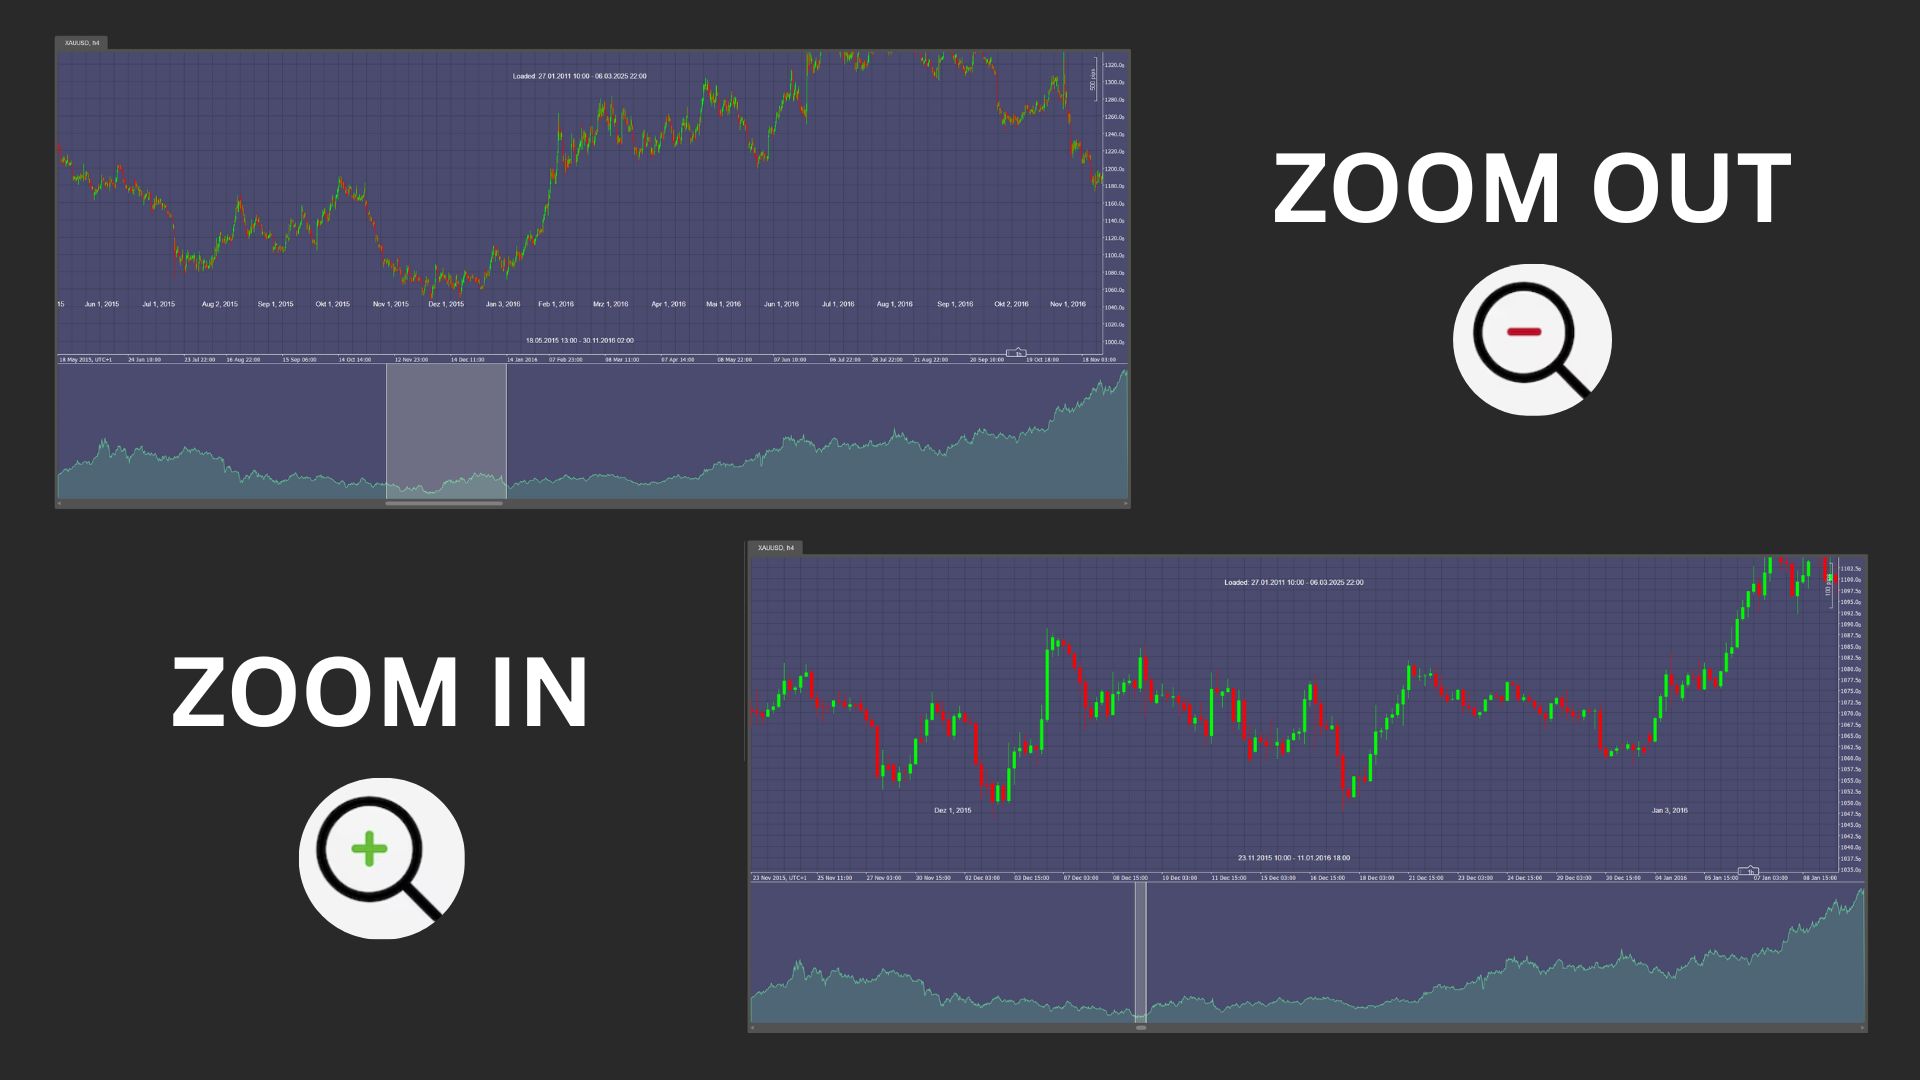
This dynamic indicator updates seamlessly as you scroll, drag, or resize your chart, ensuring you always have up-to-date information. Its intuitive design allows you to quickly identify market trends and opportunities, enhancing your ability to make timely, well-informed trading decisions.

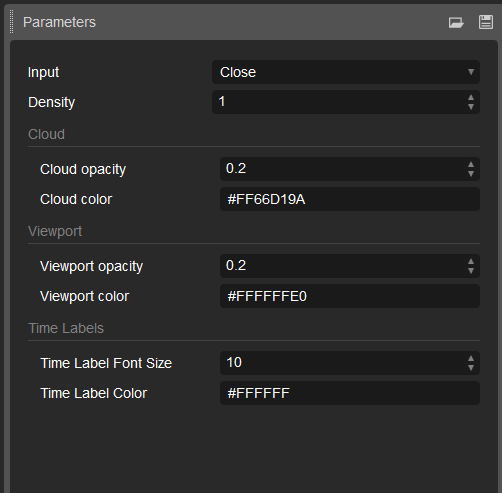
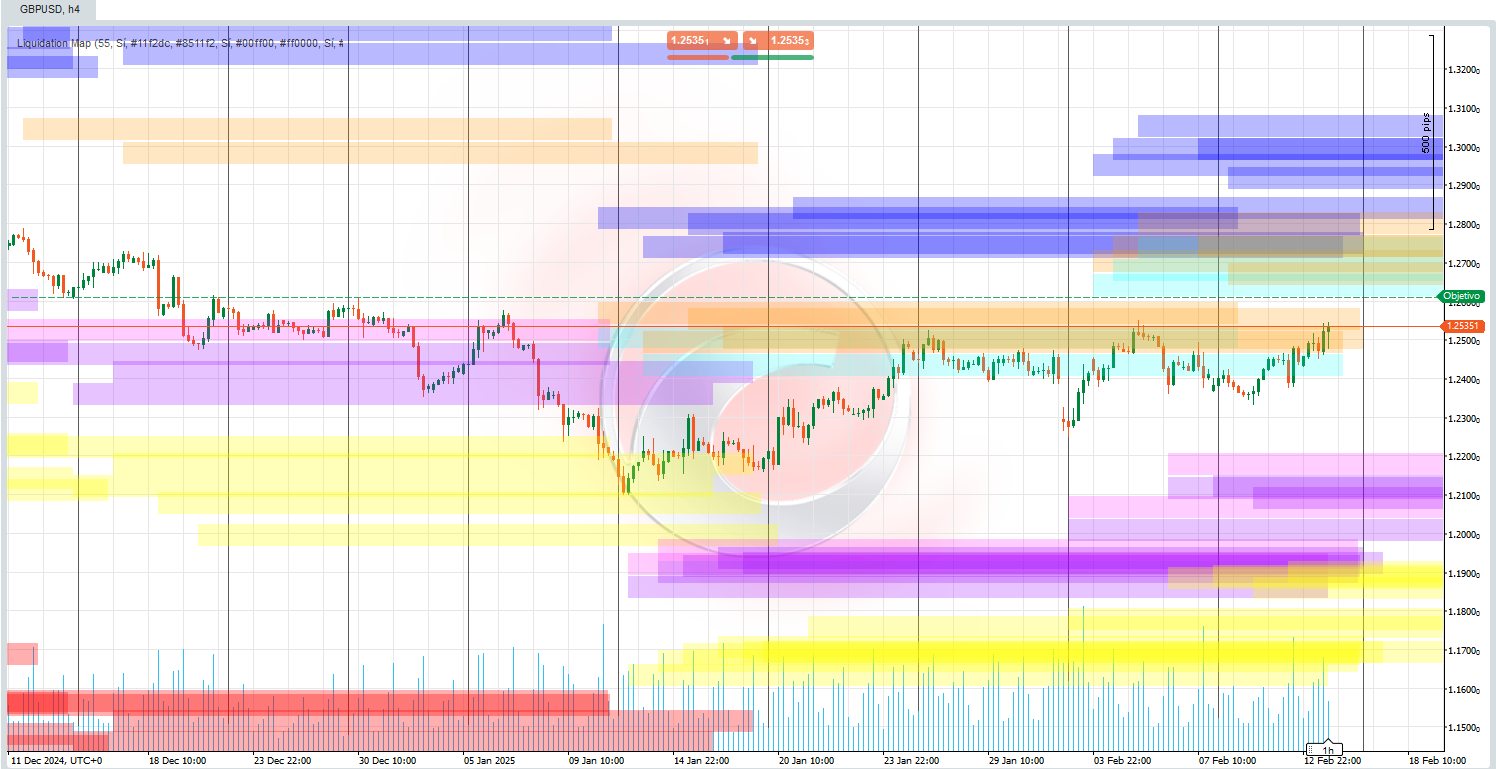
With extensive customization options for colors, opacity, and display settings, ChartOverview integrates perfectly into your personal trading setup. Empower your analysis and gain a competitive edge with a tool designed to deliver a precise and comprehensive market overview.

0.0
Reviews: 0
Customer reviews
No reviews for this product yet. Already tried it? Be the first to tell others!
More from this author
Renko Box Algo
Renko Overlay Algo: Fully Automated Renko Trading with Smart Risk Management
You may also like
Microchannels
Microchannels
Indicator
Indices
Forex
USDJPY
JPYX w HMA
JPYX Indicator with HMA
VWAP Tokyo Open
VWAP Set to Tokyo Open
Indicator
RSI
Breakout
Supertrend
Leverage Liquidation Map
📊 Liquidation Map: Potential areas where highly leveraged investors might face liquidations.
Indicator
Indices
Prop
XAUUSD
+8
FREE Squeeze Momentum from TradingView
Squeeze Momentum - Anticipate explosive market moves before they happen
Indicator
XAUUSD
Martingale
Commodities
+2
cAlgoBuddy - Zone Recovery
The Zone Recovery indicator is used in an advanced hedging strategy, opening traders in the opposite direction.
Indicator
RSI
Signal
MACD
+1
Long Wick
Identify potential reversal points in the market by detecting candles with exceptionally long upper or lower wicks
DMI CUSTOM SESSIONS
This will allow you to have SESSIONS on the chart. London, New York, Asian session and you can customize the times.
Indicator
Indices
Commodities
Forex
Smart Floating Risk - Premium version
The Floating Risk Indicator is an essential tool for traders who prioritize risk management.
Indicator
NAS100
NZDUSD
Breakout
+8
Pivot Breakout Detector
🎯 Automatically identify significant breakouts from price consolidation zones.
Indicator
Indices
RSI
XAUUSD
+7
RSI Divergence
Detects bullish and bearish divergences
Time To Break Even Indicator v2
Time To Break Even Indicator. This indicator helps you time your trade's entry.
Indicator
Breakout
VIX - volatility indicator - Renko
Volatility indicator for Renko.
KANDIKA HEAT MAP
Color-Based Market Pressure & Volatility Visualizer The Kandika Heatmap Indicator
Indicator
Indices
XAUUSD
Commodities
+5
cAlgoBuddy - Chaos Reversals
The cTrader Chaos Reversals indicator brings high-quality reversal signals to traders.
Indicator
Grid
RSI
XAUUSD
+12
PFO Price Flow Oscillator
technical analysis tool designed to provide traders with a structured view of market momentum and volatility
Indicator
Indices
ATR
Stocks
+4
UT Bot Alert
A powerful ATR-based indicator generating clear BUY/SELL signals. Features real-time alerts and customizable sensitivity
FX Market Sessions
Easily visualise Forex sessions with start/end markers and high/low levels for Sydney, Tokyo, London, and New York.