
Livelli Numeri Tondi - Indicatore per cTrader
Descrizione
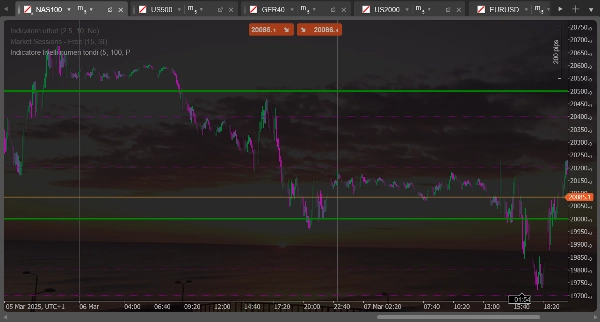
Questo indicatore disegna linee orizzontali a "numeri tondi" o livelli psicologicamente significativi sul grafico. È ideale per identificare potenziali aree di supporto e resistenza basate su livelli di prezzo rotondi che spesso hanno importanza psicologica per i trader.
Funzioni principali
- Disegna due set distinti di linee orizzontali a intervalli regolari
- Calcola automaticamente i livelli in base al prezzo di chiusura corrente
- Si aggiorna dinamicamente quando il prezzo si muove
- Offre configurazione separata per ogni set di linee (colore, stile, dimensione)
Regolazioni possibili
Per il primo set di linee (tratteggiato)
- Numero di Linee Set 1: Determina quante linee disegnare sopra e sotto il prezzo attuale (default: 5)
- Dimensione Range Set 1: Imposta la distanza tra le linee in pip (default: 100 pip)
- Colore Linee Set 1: Personalizza il colore delle linee (default: viola)
- Spessore Linee Set 1: Imposta lo spessore delle linee (default: 1 pixel)
Per il secondo set di linee (continuo)
- Numero di Linee Set 2: Determina quante linee disegnare sopra e sotto il prezzo attuale (default: 2)
- Dimensione Range Set 2: Imposta la distanza tra le linee in pip (default: 500 pip)
- Colore Linee Set 2: Personalizza il colore delle linee (default: verde)
- Spessore Linee Set 2: Imposta lo spessore delle linee (default: 1 pixel)
Utilizzo pratico
Tipicamente, il primo set (linee tratteggiate) viene utilizzato per identificare livelli psicologici minori, mentre il secondo set (linee continue) evidenzia livelli psicologici maggiori. Ad esempio, per EURUSD potresti impostare il primo set per mostrare livelli ogni 100 pip (come 1.0800, 1.0900) e il secondo set per livelli ogni 500 pip (come 1.0500, 1.1000).
Questi livelli spesso coincidono con zone di supporto o resistenza dove il prezzo potrebbe rimbalzare o rallentare prima di continuare il suo movimento.
Round Number Levels - Indicator for cTrader
Description
This indicator draws horizontal lines at "round numbers" or psychologically significant levels on the chart. It's ideal for identifying potential support and resistance areas based on round price levels that often have psychological importance for traders.
Main Features
- Draws two distinct sets of horizontal lines at regular intervals
- Automatically calculates levels based on the current closing price
- Updates dynamically as price moves
- Offers separate configuration for each set of lines (color, style, size)
Possible Adjustments
For the first set of lines (dashed)
- Number of Lines Set 1: Determines how many lines to draw above and below the current price (default: 5)
- Range Size Set 1: Sets the distance between lines in pips (default: 100 pips)
- Line Color Set 1: Customizes the color of the lines (default: purple)
- Line Width Set 1: Sets the thickness of the lines (default: 1 pixel)
For the second set of lines (solid)
- Number of Lines Set 2: Determines how many lines to draw above and below the current price (default: 2)
- Range Size Set 2: Sets the distance between lines in pips (default: 500 pips)
- Line Color Set 2: Customizes the color of the lines (default: green)
- Line Width Set 2: Sets the thickness of the lines (default: 1 pixel)
Practical Usage
Typically, the first set (dashed lines) is used to identify minor psychological levels, while the second set (solid lines) highlights major psychological levels. For example, for EURUSD, you might set the first set to show levels every 100 pips (such as 1.0800, 1.0900) and the second set for levels every 500 pips (such as 1.0500, 1.1000).
These levels often coincide with support or resistance zones where price might bounce or slow down before continuing its movement.
5 | 50 % | |
4 | 50 % | |
3 | 0 % | |
2 | 0 % | |
1 | 0 % |


