Descrição
Projeção Dinâmica de Preço 📈🔮
https://chartshots.spotware.com/c/69d5304ea1cc1
O que é?
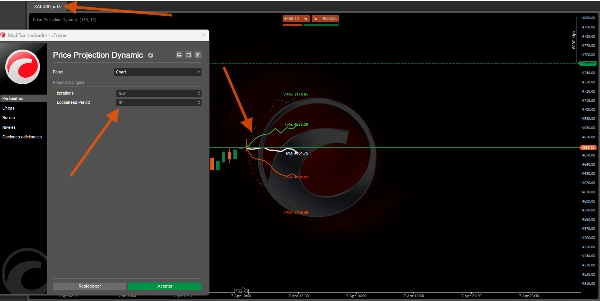
https://chartshots.spotware.com/c/69d52fb4b01cd
Projeção Dinâmica de Preço é um indicador sobreposto que projeta caminhos futuros de preço estatisticamente prováveis usando simulação de Monte Carlo e avalia o viés direcional através de um classificador de probabilidade Bayesiano. Ele responde a uma pergunta: dado como este ativo tem se movido, para onde é estatisticamente provável que vá a seguir? 📊
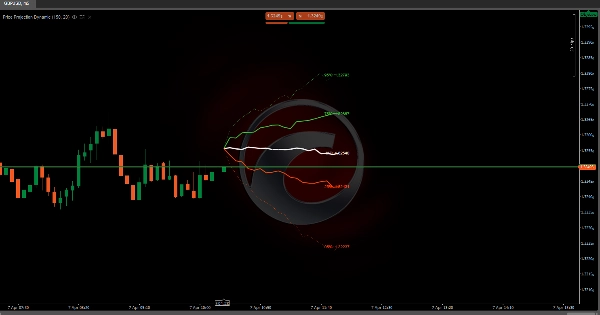
https://chartshots.spotware.com/c/69d53010d38ce
Como Funciona ⚙️
Motor 1 — Projeção Monte Carlo 🎲
O indicador analisa o histórico recente de preços e extrai retornos logarítmicos. Calcula o retorno médio e seu desvio padrão — capturando tanto o drift (tendência) quanto a volatilidade (movimento errático) 🌪️.
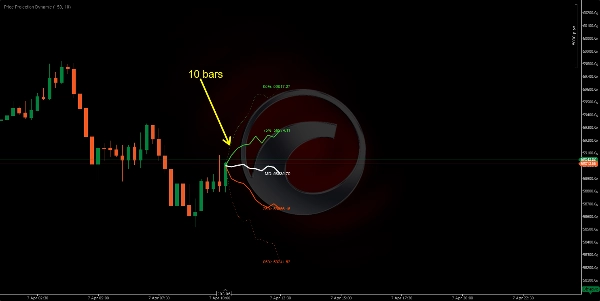
Ele executa 200 caminhos de preço simulados (até 500) para o futuro. Cada simulação é uma "caminhada aleatória" baseada na ação recente real. A partir destes, o indicador extrai 5 bandas percentis:
Banda
Significado
95%
Extremo otimista — apenas 5% das simulações foram mais altas 🚀
75%
Faixa provável superior — o preço terminou acima disso em 25% das simulações 📈
50% (MD)
Projeção mediana — o centro estatístico de todos os resultados 🎯
25%
Faixa provável inferior — o preço terminou abaixo disso em 25% das simulações 📉
05%
Extremo pessimista — apenas 5% das simulações foram mais baixas 📉🛑
Dica Profissional: Quanto mais aberto o leque, maior a volatilidade atual 📢. Um leque apertado significa que o ativo está se movendo de forma previsível 🧵.
Motor 2 — Classificador Bayesiano 🧠
Independente da projeção, este motor classifica o mercado como altista ou baixista por:
- Analisar uma janela de tempo (padrão 500 barras) 🔍.
- Medir volume relativo e momentum para barras altistas vs. baixistas.
- Calcular qual perfil a barra atual se encaixa melhor usando probabilidade Gaussiana ⚖️.
O resultado é uma percentagem de probabilidade de vitória:
Probabilidade
Interpretação
> 70%
Alta confiança altista ✅🟢
50–70%
Moderado / incerto ⚖️🟡
< 30%
Alta confiança baixista ✅🔴
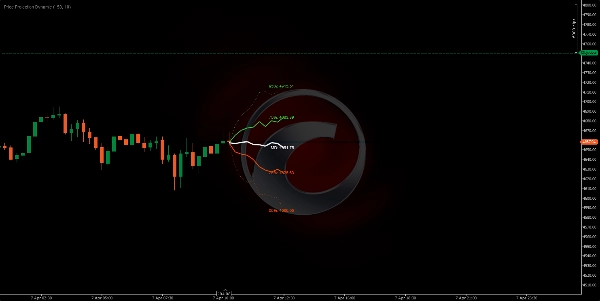
Elementos Visuais 🎨
- Linhas verdes (75%, 95%): Bandas superiores de projeção — faixa altista 🍏
- Linha branca (MD): Preço projetado mediano — caminho mais provável 🏁
- Linhas laranja (25%, 05%): Bandas inferiores de projeção — faixa baixista 🍊
- Linhas externas pontilhadas: Extremos 95% e 05% (limites de baixa probabilidade) ⚠️
- Linhas internas sólidas: 75%, 50%, 25% (zona de alta probabilidade) ✅
- Etiquetas de preço: Preço projetado exato para cada percentil 🏷️
- Painel de informações (canto superior direito): Probabilidade de vitória Bayesiana, alvo mediano, volume relativo, direção do sinal 🖥️
Como Usar 📖
- Leia a forma do leque 📢 — Se ele se expandir rapidamente, a volatilidade é alta e as projeções são menos certas.
- Use a linha mediana (MD) 🎯 como o alvo de preço futuro estatisticamente mais provável.
- Use as bandas 75%/25% 📏 como alvos superiores/inferiores realistas para negociações.
- Use as bandas 95%/05% 🛑 como limites extremos — útil para posicionamento de stop loss.
- Verifique o painel Bayesiano 🧠 — Uma probabilidade acima de 70% ou abaixo de 30% adiciona convicção direcional.
- Combine ambos os motores 🤝 — Se a linha mediana inclinar para cima E a probabilidade Bayesiana for > 70%, a configuração é estatisticamente forte.
Parâmetros Chave ⚙️
Parâmetro
O que controla
Valor maior
Valor menor
Iterações
Número de caminhos simulados
Bandas mais suaves 🌊
Cálculo mais rápido ⚡
Antecipação
Distância da projeção futura
Horizonte mais longo 🔭
Mais curto, mais confiável 🔍
Profundidade da Amostra
Barras recentes para analisar
Comportamento de longo prazo 🐢
Apenas comportamento recente 🐇
Janela do Classificador
Histórico Bayesiano
Probabilidade mais estável ⚖️
Mais reativa ⚡
Perfil do Indicador 📋
- Categoria do indicador: Estatísticas 📊
- Tipo de saída: Visualização & Sinais 🖼️
- Requisitos de dados: Apenas barras 📶
Aviso ⚠️
Este indicador projeta probabilidades estatísticas, não previsões 🔮. Simulações de Monte Carlo assumem que o futuro será parecido com o passado recente — isso falha durante eventos cisne negro 🦢 ou gaps causados por notícias. Use como uma estrutura probabilística junto com sua própria gestão de risco 🛡️.
Resumo
Separately, the Bayesian classifier evaluates market sentiment by analyzing relative volume and momentum over a configurable window, providing a win probability percentage that indicates bullish or bearish confidence. Visual elements include color-coded projection bands (green for bullish, orange for bearish), a median price line, price labels for each percentile, and an info panel displaying Bayesian probability and other metrics.
Key adjustable parameters include the number of simulation iterations, projection horizon, sample depth of historical bars, and classifier window size. The indicator requires bar data with volume and outputs visual projections and directional signals. It is designed to offer a probabilistic framework for anticipating price movement based on recent market behavior, suitable for various symbols including BTCUSD, EURUSD, GBPUSD, XAUUSD, NAS100, and others.
Avaliações de clientes
5 | 0 % | |
4 | 100 % | |
3 | 0 % | |
2 | 0 % | |
1 | 0 % |