present
Inscrivez-vous et bénéficiez d'une remise de 50 $ sur votre premier achat
Trading product for RegimeVisualizer Indicateur Flag Volume, image 1
RegimeVisualizer
Indicateur
Version 1.0, Jul 2026
Windows, Mac
Trading product for RegimeVisualizer Indicateur Flag Volume, image 2
Trading product for RegimeVisualizer Indicateur Flag Volume, image 3
Trading product for RegimeVisualizer Indicateur Flag Volume, image 4
Trading product for RegimeVisualizer Indicateur Flag Volume, image 5
Depuis le 11/01/2025
14.87M
Volume tradé
1.06M
Pips gagnés

Description

The problem with regime indicators: they change their minds.

Most regime indicators "learn" from the data while they run. You know the result: the history looks beautiful, because the labels of past bars were silently rewritten after the future arrived. This has a name — repainting — and it is the cardinal sin of any analysis tool: it looks reliable precisely because it erases its own mistakes.

Regime Visualizer makes a single promise: it never repaints.

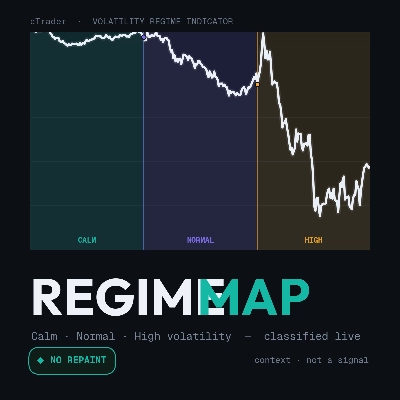
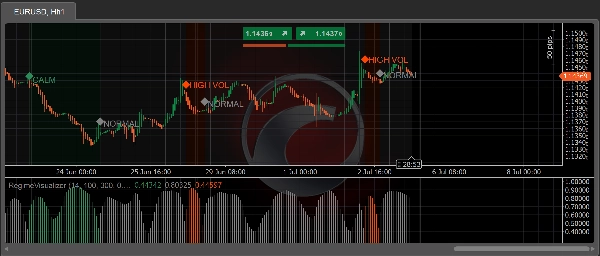
Every bar is classified into one of three volatility regimes — Calm, Normal or High — at the moment it closes. That label is final. It is never recalculated, smoothed or retroactively corrected. The screenshot you take today shows the same thing that was on the screen live, bar by bar. Deterministic: same data, same picture, on every run.

What you see on the chart:

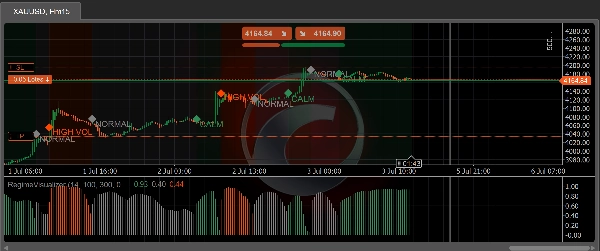
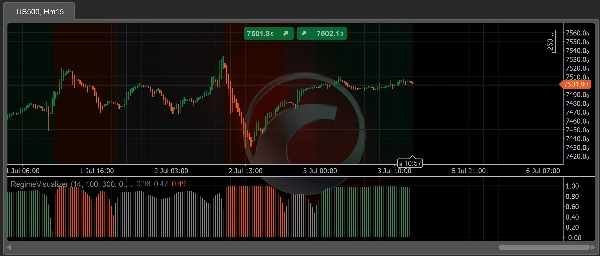
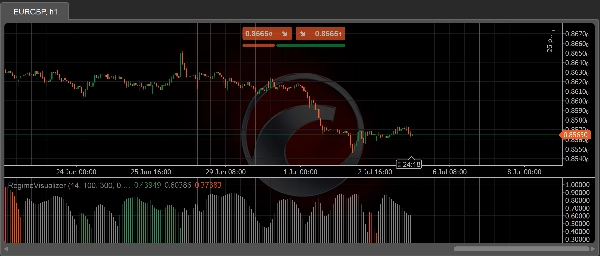
  • 🎨 Colored background per regime segment, right on the price chart
  • 📊 Confidence histogram (0–1) in a separate panel — the filtered probability of the active regime, in the regime's color
  • 🔷 Transition marker — icon + label on the bar where the regime changes
  • Each layer toggles on/off independently, with configurable colors

What it is NOT (read before installing):

  • ❌ Not a trading signal. It never tells you to buy or sell.
  • ❌ No performance promise. Volatility regime does not predict profit — this indicator makes context readable, nothing more. What you do with it is your responsibility.
  • ❌ Not adaptive. There is no online learning — on purpose: "learning while running" is exactly what makes regime indicators repaint.

How it works (for those who want to know):

A 3-state hidden Markov model (HMM) with fixed parameters runs on normalized ATR (ATR(14) / 100-bar ATR average — dimensionless, so it works on any instrument and timeframe). Inference is forward filtering only — it uses nothing but data up to the close of the current bar, with no Viterbi and no backward smoothing (the classic sources of repainting). A hysteresis layer with thresholds and a minimum dwell time turns the flickering argmax into a stable read.

Honest about its limits:

  • The first 300 bars (warmup) stay unlabeled — the indicator does not pretend to know what it does not know yet.
  • The forming bar gets no label — it is classified when it closes. That is the price of never repainting, and we pay it in front of you.

For cBot developers:

The indicator exposes the public RegimeCode series (0 = Calm, 1 = Normal, 2 = High, −1 = warmup) for consumption via Indicators.GetIndicator<RegimeVisualizer>(). Non-repainting volatility context, ready to plug into your logic.

Validation (tested, not claimed):

The non-repaint property was verified by a harness that reprocessed 100,000 real bars across 201 incremental windows — 10.1 million label comparisons, zero divergence — plus bit-identical determinism across runs.

Free. Context — not a signal.

Résumé

Profil de l'indicateur
Catégorie de l'indicateur
Volume
Type de résultat
Visualisation
Exigences en matière de données
Barres seulement
Signaux pris en charge
Volatilité

Discussion

Avis clients

0.0
Avis : 0
Avis clients
Il n'y a pas encore d'avis sur ce produit. Vous l'avez déjà essayé ? Soyez le premier à en parler aux autres !

Questions fréquentes

Flag
Volume
Market Structure
Supply & Demand
Risk Dashboard
ATR
Liquidity Grab
Les produits disponibles sur cTrader Store, notamment les bots de trading, les indicateurs et les plug-ins, sont fournis par des développeurs tiers et mis à disposition à titre informatif et à des fins d'accès technique uniquement. cTrader Store n'est pas un courtier et ne fournit aucun conseil en investissement, aucune recommandation personnelle ni aucune garantie quant aux performances futures.

Vous pourriez aussi aimer

Indicateur
Prop
VWAP
+5
VWAP is a powerful tool for intraday traders
Indicateur
Volume
Key Levels
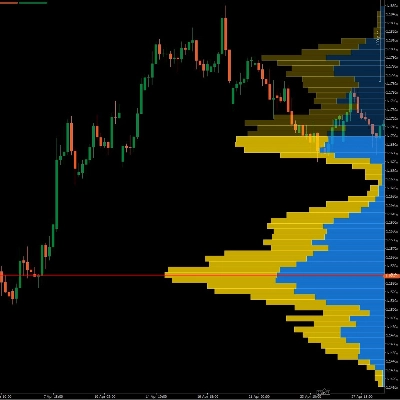
Dynamic Visible Range Volume Profile for cTrader. Real-time POC, Value Area & Smart Alerts for precise trading.
Indicateur
Signal
Fractal Arrow Buy and Sell Indicator
Indicateur
Fair Value Gap
Liquidity Grab
+2
PRO Liquidity Sweep + FVG Combo detector with custom Gold/Blue signals & alerts
Indicateur
BOS
EMA
+5
Market structure signals graded A to C, each with a drawn trade plan, plus an adaptive trend ribbon and a trend matrix
Indicateur
Forex
BTCUSD
+3
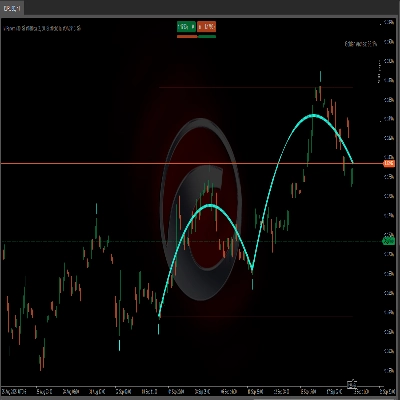
Designed to identify and visualize price reversal patterns using Bézier curves.
Indicateur
Volume
Imbalance
+5
Spot Institutional Order Flow with Proportional Volume Bubbles & Integrated Cumulative Volume Delta (CVD) Intelligence.
Indicateur
VWAP
Volume
+5
Multi VWAP. Three timeframes. One clean chart. Your Essential Trading Tool.
Indicateur
Supertrend
Moving Average
Easy Trade: Trend & Breakout Indicator for cTrader
Indicateur
ATR
BOS
+5
Market structure with BOS and CHoCH, order blocks, and retest buy/sell arrows with entry, stop and two targets
Indicateur
Forex
EURUSD
+5
Session Volume Profile is a professional volume profile indicator for cTrader.
Indicateur
BOS
Fibonacci
+5
🕐 ICT Killzones with live session High/Low levels that stop extending the moment price sweeps them. Clean, fast, daily
Indicateur
Prop
Forex
+7
The Parabolic SAR, or "Stop and Reverse," is a dynamic technical analysis tool.
Indicateur
SMC
Pro Volume Profile with Delta, Session Filters & CSV Export. Precision order flow analysis.
Indicateur
RSI
VWAP
+5
📈 Anchored VWAP with auto High/Low, session resets, Daily VWAP & TWAP — precise, Pine-accurate port.
Indicateur
AI
ATR
+19
Market Cipher A
Logo de "PivotLevels"
Les mieux notés
4.7
(4)
$25
/
$30
Indicateur
Prop
Forex
+4
It draws Pivot Levels on the chart.
Indicateur
Signal
Breakout
+1
Bolliger Bands + Hamster-Coder™ Timeframe Decoupling

Prix

Depuis le 11/01/2025
14.87M
Volume tradé
1.06M
Pips gagnés