
Bollinger Bands Indicators
Explore Bollinger Bands indicators and related chart tools for volatility and range context. Compare bands with squeeze detection, adaptive settings, and alert options that support breakout or mean reversion trading strategy styles. Great when you want to spot expanding volatility, define realistic targets, and avoid chasing moves outside normal range behaviour.
Инструменты
Сравнение инструментов
Частые вопросы






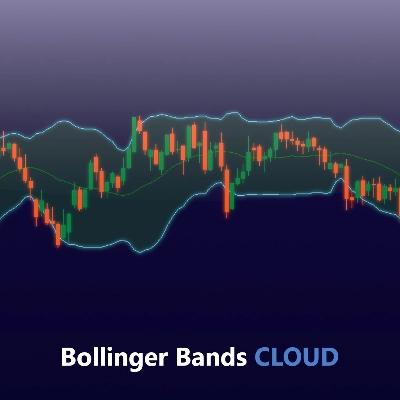
Сравнение инструментов
Продукт | Отзывы | Скачивания | Продажи | Цена | Совместимость с платформами |
|---|---|---|---|---|---|
Follow Line | 4.5 (6) | 2.79K | — | Бесплатно | Windows, Mac |
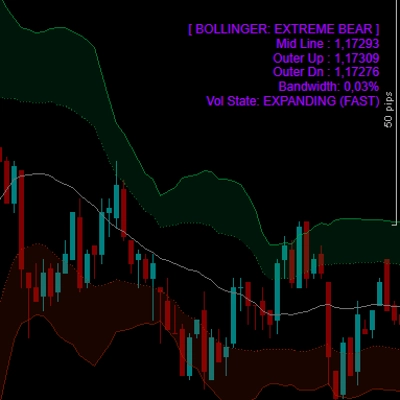
Bollinger Bands Advanced | 4.0 (3) | — | 2 | $20 | Windows, Mac |
Advanced RSI Indicator | 5.0 (1) | 564 | — | Бесплатно | Windows, Mac |
QQE Qualitative Quantity Estimation | 4.7 (3) | — | 2 | $19 | Windows, Mac |
E7 Indicators Free Overlays | 5.0 (2) | 446 | — | Бесплатно | Windows, Mac |
Bollinger Bands Breakout Oscillator (+ Alerts) | 4.5 (4) | — | 2 | $19 | Windows, Mac |
REDGREENZONEREVERSAL | 5.0 (1) | 271 | — | Бесплатно | Windows, Mac |
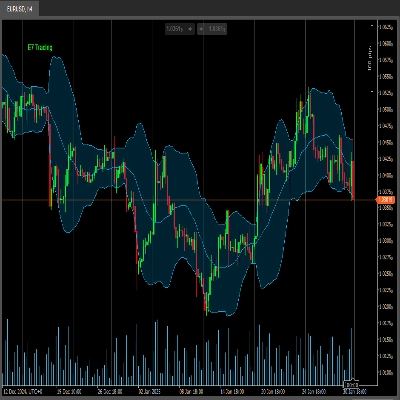
[Hamster-Coder] Bollinger Bands | 4.5 (4) | — | 1 | $19 | Windows, Mac |
E7 Indicators Free Studies | — | 209 | — | Бесплатно | Windows, Mac |
Ten Thousand Functions Bands Cloud(First Edition) | 4.5 (2) | — | 1 | $19 | Windows, Mac |
Waddah Attar Explosion | — | 194 | — | Бесплатно | Windows, Mac |
HTFBB | 4.5 (2) | — | 1 | $19 | Windows, Mac |
Repiptor BB Colored Width | 5.0 (1) | 167 | — | Бесплатно | Windows, Mac |
signal indicator 1 | — | — | 1 | $50 | Windows, Mac |
Repiptor BB Width | — | 116 | — | Бесплатно | Windows, Mac |
Bollinger Bands Cloud | 4.4 (5) | — | — | $19 | Windows, Mac |
TraderMaxBBFilterX | 4.5 (4) | — | — | $19 | Windows, Mac |
Частые вопросы
Bollinger Bands are a volatility envelope: a moving average, typically twenty periods, with lines a set number of standard deviations above and below, commonly two. The envelope widens when prices spread out and narrows when they cluster, so its width is a direct reading of recent volatility.
A squeeze is a stretch of unusually narrow band width, which can come before a volatility expansion but says nothing about its direction. Detection tools compare the width with its own recent history or check when the bands move inside a Keltner Channel, then mark or alert the condition.
In a strong trend each close keeps stretching the standard deviation, so the envelope expands with price and repeated touches of the outer line are normal. Reading every touch as overbought or oversold therefore often fails in trends; mean-reversion ideas suit ranges better, and either approach can produce losses.
Yes, the lines plot directly on price, which makes the concept approachable, and pairing them with an oscillator such as RSI or a higher-timeframe trend view adds context. Experienced chartists often adjust the deviation multiplier or the moving-average type, so check that a custom version exposes those settings.
Custom versions from the Store need cTrader Windows or Mac; add one to a chart from the Indicator icon, then set period and deviation in its properties. Volatility differs between forex pairs, gold, indices and crypto, so a setting that fits one symbol or timeframe may need changing on another.