Описание
🚀Проекция цены по объему колебаний: 📈
https://chartshots.spotware.com/c/6980f0f0287fb
Проекция цены по объему колебаний Price Projection Swing Volume — это продвинутый инструмент прогнозирования, предназначенный для отображения наиболее вероятного будущего пути актива на основе недавних колебаний цены и гармонических соотношений Фибоначчи. Он определяет текущий рыночный диапазон и строит многоэтапную "дорожную карту" потенциального ценового движения.
🔍 Анализ рынка и условия
https://chartshots.spotware.com/c/6980f104dab21
Этот алгоритм сосредоточен на определении "рыночного конверта" путем анализа:
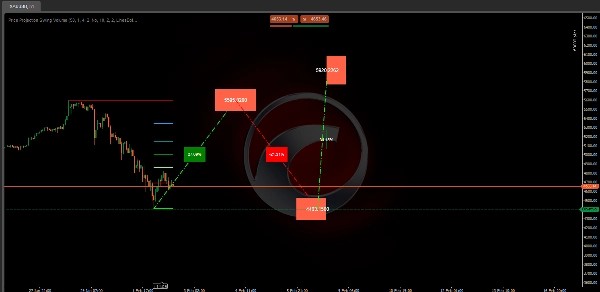
- Экстремальных точек колебаний: Он сканирует определенный период обратного просмотра (например, последние 50 баров), чтобы найти абсолютный максимум и минимум.
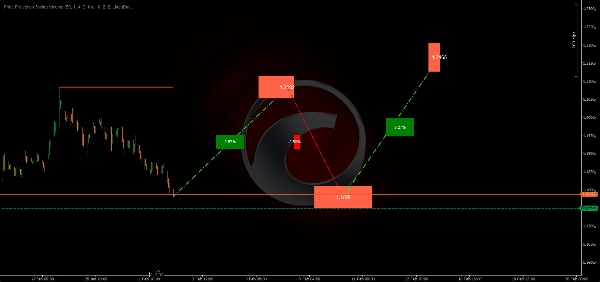
- Зоны отката: Автоматически рассчитывает и отображает пять ключевых уровней Фибоначчи (23.6%, 38.2%, 50%, 61.8% и 78.6%) внутри текущего колебания для определения зон интереса.
- Гармонические проекции: Используя коэффициент проекции (по умолчанию 0.618), алгоритм рассчитывает трехсегментный будущий путь на основе измеренных движений от самой последней точки колебания.
🟢 Как интерпретировать сигналы и визуализации
https://chartshots.spotware.com/c/6980f126d875a
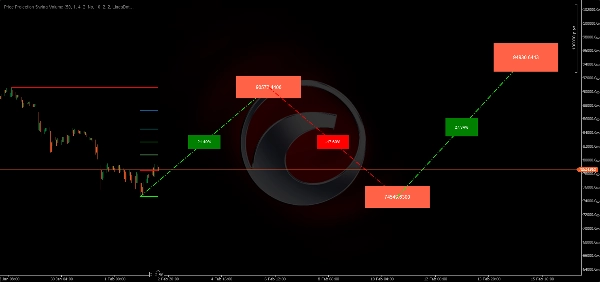
- Горизонтальные линии колебаний: Толстые красная (максимум) и зеленая (минимум) линии обозначают текущие границы рынка. Пробой этих линий часто сигнализирует о смене тренда.
- Путь проекции (пунктирные линии): Диагональные линии прогнозируют "зигзагообразное" движение. Это предсказание алгоритма о том, как цена может двигаться для достижения конечной цели.
- Процентные метки: Расположены на диагональных линиях, показывают ожидаемый % прироста или убытка для конкретного сегмента движения.
- Целевые ценовые блоки: Цветные блоки в конце каждого сегмента показывают точный уровень цены, на который ориентируется алгоритм.
⚙️ Ключевые настройки и параметры
- Период обратного просмотра (50): Определяет масштаб колебаний. Большое число ищет "макро" колебания, а меньшее — "микро" скальпинговые колебания.
- Коэффициент проекции (0.618): Этот "золотой коэффициент" определяет глубину и высоту прогнозируемых зигзагов. Вы можете настроить его для более или менее агрессивных целей.
- Визуальная настройка: Полностью настраиваемые цвета для бычьих/медвежьих проекций и конкретных уровней Фибоначчи, чтобы соответствовать теме вашего графика.
🚀 Типичные случаи использования и сценарии
- Установка целей: Используйте проецируемые ценовые блоки для установки уровней тейк-профита при свинг-трейдинге.
- Ожидание разворотов: Если проекция показывает глубокий откат перед движением вверх, трейдеры могут ждать, пока цена достигнет пунктирной линии "долины", прежде чем входить в позицию.
- Измеренные движения: Отлично подходит для трейдеров, которые следуют паттернам "ABCD" или гармоническому ценовому движению.
👤 Целевая аудитория трейдеров
- Свинг- и трендовые трейдеры: Идеально подходит для тех, кто держит позиции несколько дней и нуждается в дорожной карте потенциальных уровней сопротивления.
- Гармонические трейдеры: Отлично для пользователей, которые опираются на соотношения Фибоначчи, но хотят, чтобы расчеты выполнялись автоматически.
- Уровень опыта: Средний. Трейдерам следует понимать, что это прогнозы и их следует использовать вместе с другими подтверждениями.
⚠️ Важные ограничения и заметки по использованию
- Динамическое обновление: Проекции и уровни колебаний будут "сдвигаться" в реальном времени, если в окне обратного просмотра появится новый максимум или минимум.
- Инициализация: Индикатор требует минимального объема истории (равного периоду обратного просмотра), прежде чем сможет точно начать отображение.
Сводка
The indicator visually displays horizontal swing boundary lines (red for highs, green for lows), dotted diagonal projection lines with percentage gain or loss labels, and target price boxes indicating exact projected price levels. These features help traders set take profit targets, anticipate retracements or reversals, and identify measured moves consistent with harmonic patterns.
Key customizable settings include the lookback period for swing scale, projection ratio for target aggressiveness, and visual color options for bullish/bearish projections and Fibonacci levels. The indicator updates dynamically as new highs or lows form within the lookback window and requires sufficient historical data to initialize.
Price Projection Swing Volume supports multiple markets including BTCUSD, EURUSD, GBPUSD, NZDUSD, XAUUSD, NAS100, and USDJPY, making it suitable for traders using Fibonacci-based harmonic strategies and swing trading approaches.