
Описание
Price Magnet: Расширенная плотность цены и институциональные уровни
Price Magnet — это профессиональный аналитический инструмент для cTrader, предназначенный для выявления зон, где "умные деньги" накапливают позиции. В отличие от стандартных осцилляторов или индикаторов тренда, Price Magnet использует математический подход для определения зон максимального интереса рынка путем расчета плотности цены.
Как это работает
Рынок часто возвращается к уровням, на которых он провел больше всего времени. Это и есть "магниты". Этот индикатор сканирует определенную историческую глубину, группирует ценовое движение в частотные кластеры и выделяет самые сильные уровни, которые, вероятно, будут действовать как будущие магниты для цены.
Подробное руководство по параметрам
Чтобы максимально эффективно использовать Price Magnet, важно понимать его настройки:
- Глубина анализа (свечи): Определяет, сколько исторических свечей анализирует индикатор.
-
- Краткосрочный (50-100): Лучший для скальпинга и дневной торговли.
- Долгосрочный (300-500): Лучший для определения основных институциональных зон "S&R".
- Сдвиг назад: Позволяет сместить окно анализа в прошлое. Полезно для тестирования, как исторические зоны плотности влияли на последующие движения цены.
- Шаг группировки (цена): Самая важная настройка. Определяет "чувствительность" магнита.
- Источник цены: Выберите, какую часть свечи анализировать.
-
- Закрытие: Стандартный анализ.
- Медиана / Типичная: Часто более точный, так как учитывает весь диапазон свечи.
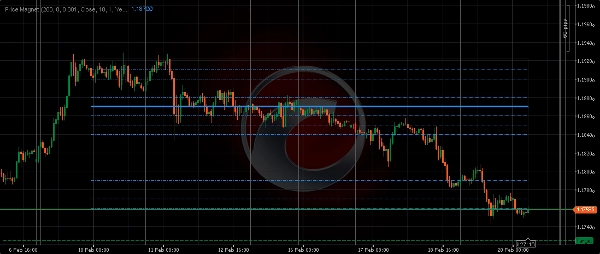
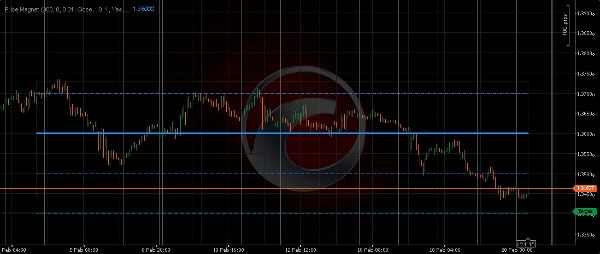
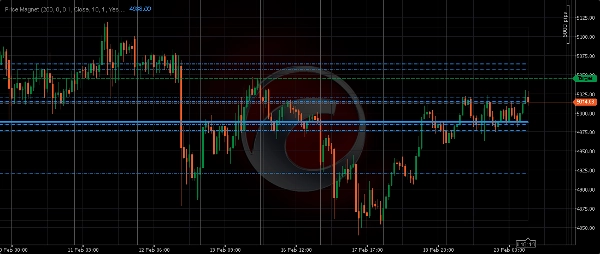
- Отображаемые уровни: Определяет, сколько магнитных уровней рисовать (от 1 до 10). Самый частый уровень всегда отображается более толстой линией.
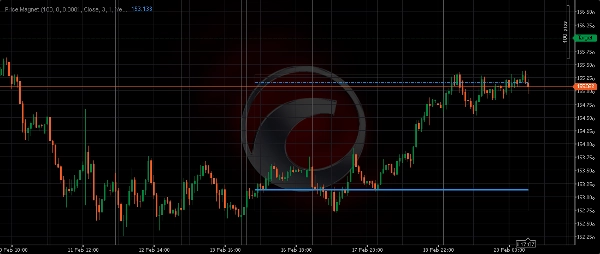
- Визуальные настройки (показать зону/линии плотности): Включает или отключает фоновый прямоугольник (зону) и горизонтальные линии. Зона представляет собой общие границы анализируемого ценового движения, обеспечивая четкое визуальное представление текущего торгового диапазона.
Советы по торговой стратегии
- Среднее отклонение: Когда цена значительно отклоняется от "Главной магнитной линии", ищите сигналы истощения для торговли возврата к магниту.
- Подтверждение пробоя: Если цена пробивает сильный магнитный уровень и повторно тестирует его, этот уровень часто меняет роль с сопротивления на поддержку.
- Цели по прибыли: Используйте вторичные магнитные уровни в качестве целевых точек для ваших сделок.
Price Magnet упрощает сложные данные рыночного профиля в наглядные уровни, давая вам профессиональное преимущество в любых рыночных условиях.
Сводка
Key configurable parameters include analysis depth (short-term for scalping/day trading or long-term for major institutional zones), back shift for historical analysis, grouping step to adjust sensitivity (with recommended values for instruments like EURUSD, Gold, and Bitcoin), and price source selection (close, median, or typical price). Users can set the number of magnetic levels to display and toggle visual elements such as density zones and lines.
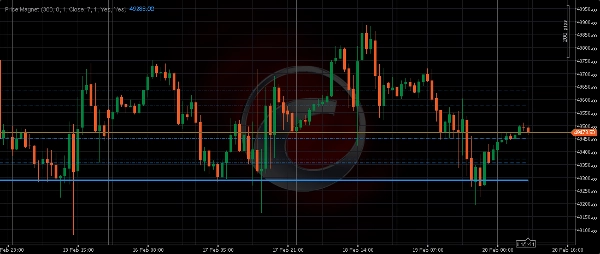
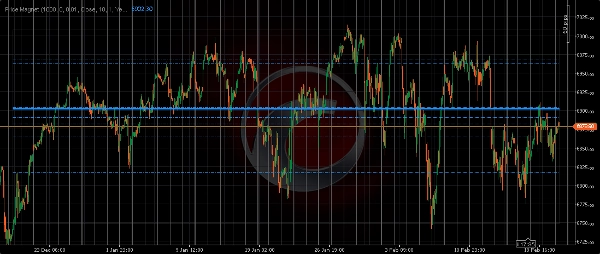
Price Magnet supports various markets including Forex pairs (EURUSD, GBPUSD, NZDUSD, USDJPY), commodities (Gold), cryptocurrencies (Bitcoin), and indices (US 30, NAS100, US 500). It aids trading strategies such as mean reversion, breakout confirmation, and setting take profit targets based on secondary magnetic levels. The tool simplifies complex market profile data into actionable visual levels to assist traders in identifying institutional support and resistance zones.
Отзывы покупателей
5 | 50 % | |
4 | 25 % | |
3 | 25 % | |
2 | 0 % | |
1 | 0 % |


