
Price Projection Swing Volume
อินดิเคเตอร์
323 ดาวน์โหลด
เวอร์ชัน 1.0, Feb 2026
Windows, Mac
คำอธิบาย
🚀การคาดการณ์ราคาปริมาณสวิง: 📈
https://chartshots.spotware.com/c/6980f0f0287fb
Price Projection Swing Volume เป็นเครื่องมือทำนายขั้นสูงที่ออกแบบมาเพื่อวางแผนเส้นทางในอนาคตที่เป็นไปได้มากที่สุดของสินทรัพย์โดยอิงจากการสวิงราคาล่าสุดและ อัตราส่วนฮาร์มอนิกฟีโบนัชชี. มันระบุช่วงตลาดปัจจุบันและคาดการณ์ "แผนที่ถนน" หลายขั้นตอนสำหรับการเคลื่อนไหวของราคาในอนาคต
🔍 การวิเคราะห์ตลาด & สภาพตลาด
https://chartshots.spotware.com/c/6980f104dab21
อัลกอริทึมนี้เน้นการระบุ "ซองตลาด" โดยการวิเคราะห์:
- จุดสวิงสุดขีด: มันสแกนช่วง Lookback Period ที่กำหนด (เช่น 50 แท่งล่าสุด) เพื่อหาค่าสูงสุดสูงสุดและต่ำสุดต่ำสุดอย่างแท้จริง
- โซนการรีเทรซเมนต์: มันคำนวณและวางแผนระดับฟีโบนัชชีหลักห้าระดับ (23.6%, 38.2%, 50%, 61.8%, และ 78.6%) ภายในสวิงปัจจุบันโดยอัตโนมัติเพื่อระบุพื้นที่ที่น่าสนใจ
- การคาดการณ์ฮาร์มอนิก: โดยใช้ อัตราส่วนการคาดการณ์ (ค่าเริ่มต้น 0.618), อัลกอริทึมคำนวณเส้นทางอนาคตสามช่วงโดยอิงจากการเคลื่อนไหวที่วัดได้จากจุดสวิงล่าสุด
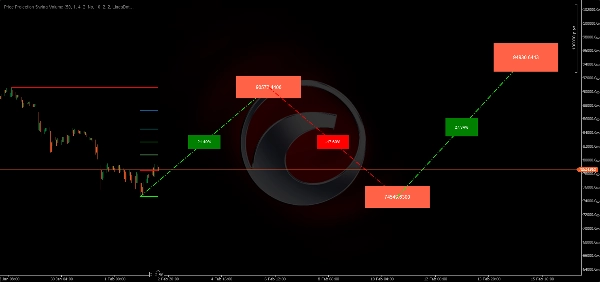
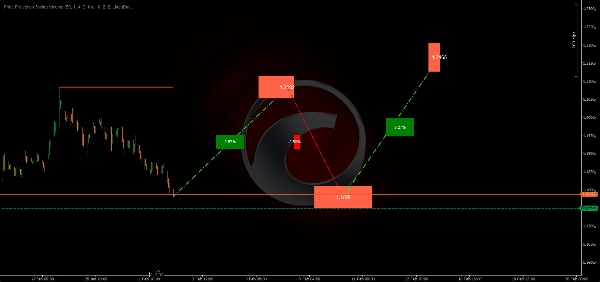
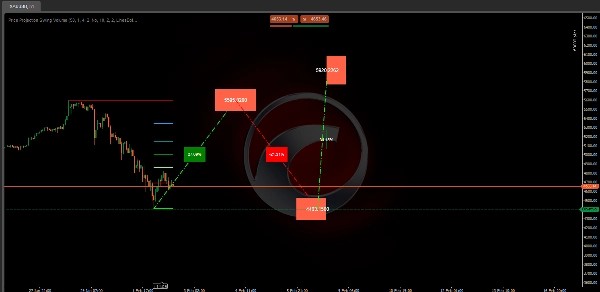
🟢 วิธีการตีความสัญญาณ & ภาพประกอบ
https://chartshots.spotware.com/c/6980f126d875a
- เส้นสวิงแนวนอน: เส้นหนาสี แดง (สูง) และ เขียว (ต่ำ) แสดงขอบเขตปัจจุบันของตลาด การที่ราคาทะลุเส้นเหล่านี้มักบ่งชี้ถึงการเปลี่ยนแปลงแนวโน้ม
- เส้นทางการคาดการณ์ (เส้นประ): เส้นทแยงมุมทำนายการเคลื่อนไหวแบบ "ซิกแซก" นี่คือการทำนายของอัลกอริทึมว่าราคาจะเคลื่อนไหวอย่างไรเพื่อไปถึงเป้าหมายสูงสุด
- ป้ายเปอร์เซ็นต์: ตั้งอยู่บนเส้นทแยงมุม แสดง เปอร์เซ็นต์กำไรหรือขาดทุนที่คาดหวัง สำหรับช่วงการเคลื่อนไหวเฉพาะนั้น
- กล่องราคาที่ตั้งเป้า: กล่องสีที่ปลายแต่ละช่วงแสดง ระดับราคาที่แน่นอน ที่อัลกอริทึมตั้งเป้าไว้
⚙️ การตั้งค่า & พารามิเตอร์หลัก
- ช่วงเวลาย้อนกลับ (50): กำหนดขนาดของการสวิง ตัวเลขที่สูงกว่าจะมองหาการสวิง "มาโคร" ขณะที่ตัวเลขที่ต่ำกว่าจะเน้นการสวิง "ไมโคร" สำหรับการเก็งกำไร
- อัตราส่วนการคาดการณ์ (0.618): "อัตราส่วนทองคำ" นี้กำหนดความลึกและความสูงของซิกแซกที่คาดการณ์ไว้ คุณสามารถปรับเปลี่ยนเพื่อเป้าหมายที่รุนแรงมากขึ้นหรือน้อยลง
- การปรับแต่งภาพ: ปรับสีได้เต็มที่สำหรับการคาดการณ์ขาขึ้น/ขาลงและระดับฟีโบนัชชีเฉพาะเพื่อให้เข้ากับธีมแผนภูมิของคุณ
🚀 กรณีการใช้งาน & สถานการณ์ทั่วไป
- การตั้งเป้าหมาย: ใช้กล่องราคาที่คาดการณ์ไว้เพื่อกำหนดระดับทำกำไรสำหรับการเทรดแบบสวิง
- การคาดการณ์การกลับตัว: หากการคาดการณ์แสดงการรีเทรซเมนต์ลึกก่อนการเคลื่อนไหวขึ้น เทรดเดอร์สามารถรอให้ราคาชนเส้นประ "หุบเขา" ก่อนเข้าตลาด
- การเคลื่อนไหวที่วัดได้: เหมาะสำหรับเทรดเดอร์ที่ติดตามรูปแบบ "ABCD" หรือการเคลื่อนไหวราคาฮาร์มอนิก
👤 โปรไฟล์เทรดเดอร์เป้าหมาย
- เทรดเดอร์สวิง & เทรนด์: เหมาะสำหรับผู้ที่ถือสถานะหลายวันและต้องการแผนที่ถนนของแนวต้านที่เป็นไปได้
- เทรดเดอร์ฮาร์มอนิก: เหมาะสำหรับผู้ใช้ที่พึ่งพาอัตราส่วนฟีโบนัชชีแต่ต้องการให้คำนวณทางคณิตศาสตร์โดยอัตโนมัติ
- ระดับประสบการณ์: ระดับกลาง เทรดเดอร์ควรเข้าใจว่านี่คือ การคาดการณ์ และควรใช้ร่วมกับการยืนยันอื่นๆ
⚠️ ข้อจำกัดสำคัญ & หมายเหตุการใช้งาน
- การอัปเดตแบบไดนามิก: การคาดการณ์และระดับสวิงจะ "เลื่อน" แบบเรียลไทม์หากมีการสร้างค่าสูงหรือค่าต่ำใหม่ภายในหน้าต่างย้อนกลับ
- การเริ่มต้น: ตัวบ่งชี้ต้องการประวัติข้อมูลขั้นต่ำ (เท่ากับช่วงเวลาย้อนกลับ) ก่อนที่จะเริ่มวางแผนได้อย่างแม่นยำ
สรุป
สรุปโดย AI
Price Projection Swing Volume is an advanced indicator designed for swing and trend traders to forecast potential future price movements. It analyzes recent price swings within a user-defined lookback period (default 50 bars) to identify extreme swing points—the highest highs and lowest lows—and calculates key Fibonacci retracement levels (23.6%, 38.2%, 50%, 61.8%, 78.6%) within the current market range. Using a harmonic projection ratio (default 0.618), it generates a three-segment zigzag projection path that maps likely price targets.
The indicator visually displays horizontal swing boundary lines (red for highs, green for lows), dotted diagonal projection lines with percentage gain or loss labels, and target price boxes indicating exact projected price levels. These features help traders set take profit targets, anticipate retracements or reversals, and identify measured moves consistent with harmonic patterns.
Key customizable settings include the lookback period for swing scale, projection ratio for target aggressiveness, and visual color options for bullish/bearish projections and Fibonacci levels. The indicator updates dynamically as new highs or lows form within the lookback window and requires sufficient historical data to initialize.
Price Projection Swing Volume supports multiple markets including BTCUSD, EURUSD, GBPUSD, NZDUSD, XAUUSD, NAS100, and USDJPY, making it suitable for traders using Fibonacci-based harmonic strategies and swing trading approaches.
โปรไฟล์อินดิเคเตอร์
รีวิวจากลูกค้า
0.0
รีวิว: 0
รีวิวจากลูกค้า
ยังไม่มีรีวิวสำหรับผลิตภัณฑ์นี้ หากเคยลองแล้ว ขอเชิญมาเป็นคนแรกที่บอกคนอื่น!
การสนทนา
คำถามที่พบบ่อย
BTCUSD
Fibonacci
ZigZag
Scalping
EURUSD
GBPUSD
NZDUSD
XAUUSD
NAS100
USDJPY
ผลิตภัณฑ์ที่มีให้บริการผ่าน cTrader Store รวมถึงบอทการเทรด อินดิเคเตอร์ และปลั๊กอิน มีให้บริการโดยนักพัฒนาบุคคลที่สามและมีไว้เพื่อวัตถุประสงค์ในการเข้าถึงข้อมูลและทางเทคนิคเท่านั้น cTrader Store ไม่ใช่โบรกเกอร์และไม่ได้ให้คำแนะนำการลงทุน คำแนะนำส่วนบุคคล หรือการรับประกันผลการดำเนินงานในอนาคต


ราคา
ตั้งแต่ 03/10/2024
163
การขาย
38.93K
ติดตั้งฟรี