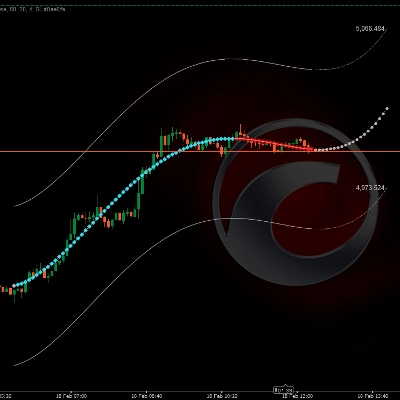
📊 ช่องทางการพยากรณ์ราคาพหุนาม
https://chartshots.spotware.com/c/699603101593d
🔎 มันทำอะไร?
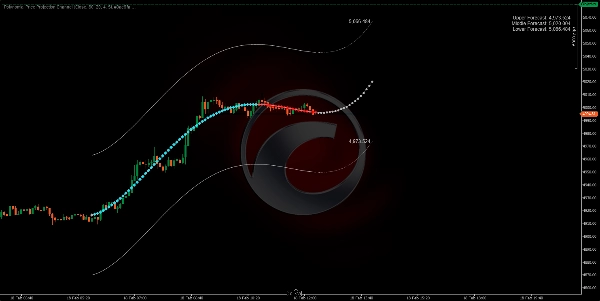
https://chartshots.spotware.com/c/69960348da652
เหมาะสมกับ เส้นโค้งทางคณิตศาสตร์ ในช่วงราคาปิด N ครั้งล่าสุดและ ขยายไปยังอนาคต เป็นการพยากรณ์ รอบเส้นโค้งนั้นจะวาด ช่องบนและล่าง ซึ่งความกว้างจะปรับตามความผันผวนของตลาดล่าสุดโดยอัตโนมัติ
⚙️ ตรรกะทำงานอย่างไร?
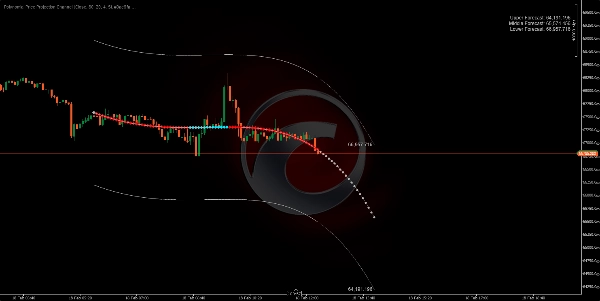
- นำแท่งเทียน N แท่งล่าสุด (แท่งย้อนหลัง) และคำนวณเส้นโค้งพหุนามที่เหมาะสมที่สุดกับราคานั้นโดยใช้วิธีสแควร์น้อยที่สุด
- ขยายเส้นโค้ง ไปข้างหน้า (แท่งพยากรณ์) เป็นการพยากรณ์ทางคณิตศาสตร์ของแนวโน้มปัจจุบัน
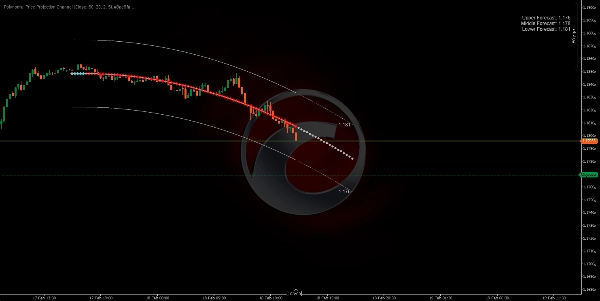
- สร้างช่องทาง โดยเลื่อนเส้นโค้งขึ้นและลงโดยใช้ ช่วงแท่งเทียนสูงสุด ของช่วงเวลาที่วิเคราะห์ × 2
https://chartshots.spotware.com/c/6996039a07e3a
🛠️ พารามิเตอร์หลัก
พารามิเตอร์
ค่าเริ่มต้น
วัตถุประสงค์
แท่งย้อนหลัง
80
จำนวนแท่งเทียนย้อนหลังที่วิเคราะห์
แท่งพยากรณ์
20
จำนวนแท่งเทียนที่พยากรณ์ไปข้างหน้า
ลำดับพหุนาม
4
ความยืดหยุ่นของเส้นโค้ง (สูง = เส้นโค้งมากขึ้น)
ข้อมูลนำเข้า
ปิด
ราคาฐานสำหรับการคำนวณ
🎯 วิธีใช้?
🟢 โอกาสซื้อ → ราคาสัมผัสแถบล่างและการพยากรณ์ชี้ขึ้น
🔴 โอกาสขาย → ราคาสัมผัสแถบบนและการพยากรณ์ชี้ลง
⚠️ ยืนยันเสมอ ด้วยปัจจัยอื่นก่อนการเทรด ตัวชี้วัดนี้เป็นการประมาณทางคณิตศาสตร์ ไม่ใช่การทำนายที่รับประกัน
5 | 0 % | |
4 | 100 % | |
3 | 0 % | |
2 | 0 % | |
1 | 0 % |


!["High-Low Divergence [Iridio Capital]" โลโก้](https://cdn.ctrader.com/image/webp/443c4661-7abb-40f1-842f-4b6ec560649b_40914)


