
Açıklama
YÜKSEK KURUMSAL İLGİ BÖLGELERİNİ BELİRLEYİN: Molalarda DAHA FAZLA HACİM olduğunda, büyük oyunculardan DAHA FAZLA KATILIM vardır.
• ⚖️ GÜÇ DENGESİNİ ÖLÇÜN: Her fiyat bölgesinde ALIM veya SATIM BASKINLIĞI olup olmadığını görün
• 🎯 ANA SEVİYELERİ TESPİT EDİN: Yüksek kırılma hacmine sahip bölgeler GELECEK DESTEK/REZİSTANS olarak sıklıkla işlev görür
• ✅ Hareketleri doğrulayın: Yüksek hacimli bir KIRILIM gerçek olma olasılığı daha yüksektir
https://chartshots.spotware.com/c/6941a3f65f376
📈 NASIL OKUNUR?
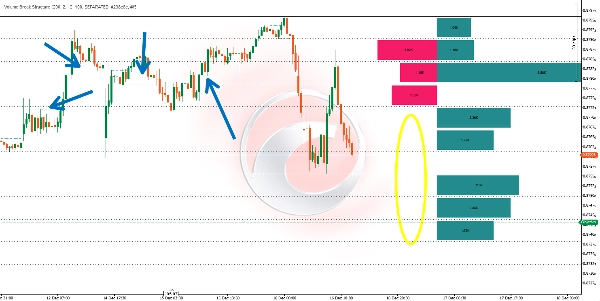
📊 Yatay Çizgiler
• Her çizgi, bir YAPI KIRILMASI olduğu seviyeyi gösterir
• 🟢 BOĞA kırılmaları
• 🔴 AYI kırılmaları
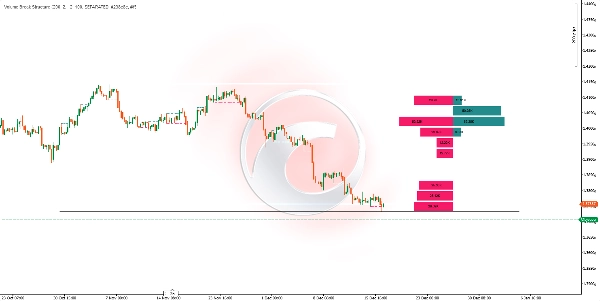
📈 Histogram
• Grafiğin SAĞ TARAFINDA yer alır
• Eşit fiyat aralıklarını temsil eden SATIRLARA bölünmüştür
• 📗 ALIM BASKISI çubukları: BİRİKMİŞ o bölgedeki boğa kırılma hacmi
• 📕 SATIM BASKISI çubukları: BİRİKMİŞ o bölgedeki ayı kırılma hacmi
• ⬆️ Çubuk boyutu: DAHA BÜYÜK boyut, o seviyedeki daha yüksek hacmi gösterir
https://chartshots.spotware.com/c/6941a4346ede0
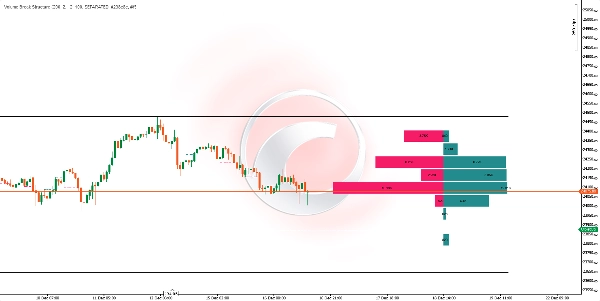
🟦 Izgara
• Katı üst ve alt çizgiler analiz edilen dönemin MAKSİMUM ve MİNİMUM ARALIĞINI işaret eder
• Noktalı çizgiler bu aralığı daha kolay okunması için EŞİT BÖLÜMLERE ayırır
⚙️ 🔧 ANA PARAMETRELER
ParametreFonksiyon
🕯️ Hesaplama Çubukları
Geriye doğru analiz edilen mum sayısı GERİYE DOĞRU
🎚️ Salınım Uzunluğu
DÖNÜŞ NOKTALARINI algılama duyarlılığı (DAHA YÜKSEK = daha az sinyal, DAHA GÜVENİLİR)
📊 Histogram Satırları
Histogramdaki BÖLÜMLER/SATIR SAYISI
📏 Histogram Genişliği
Histogramın GÖRSEL GENİŞLİĞİ
👁️ Görüntüleme Modu
AYRI (al/sat) veya TOPLANMIŞ (toplam hacim)
🔄 NE ZAMAN GÜNCELLENİR?
🕒 Gösterge, her mumun KAPANIŞINDA OTOMATİK OLARAK YENİDEN HESAPLANIR ve oluşan yeni YAPI KIRILMASINI dahil eder.
💡 🤝 NASIL BİRLEŞTİRİLİR?
📈 TREND ANALİZİ İLE
• Bir YUKARI TRENDDE, potansiyel girişler için ALIM BASKISI HACMİNİN DOMİNANT OLDUĞU bölgeleri arayın GERİ ÇEKİLMEDE
• Bir AŞAĞI TRENDDE, potansiyel girişler için SATIM BASKISI HACMİNİN DOMİNANT OLDUĞU bölgeleri arayın SEKMEDE
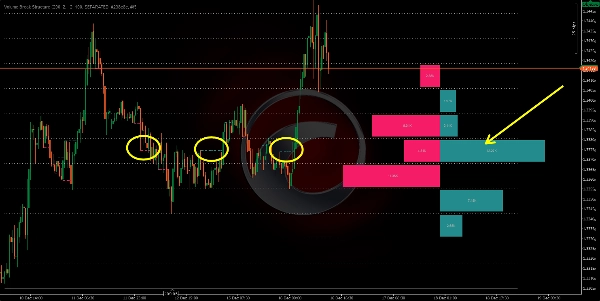
🛡️ DESTEK ve DİRENÇ İLE
• En YÜKSEK KIRILMA HACMİNE sahip seviyeler sıklıkla GELECEK TEPKİ BÖLGELERİ olur
• Histogramı, alıcılar veya satıcılar tarafından en çok "KORUNAN" bölgeleri belirlemek için kullanın
🌊 EMİR AKIŞI İLE
• Histogram okumalarını GERÇEK ZAMANLI EMİR AKIŞI araçlarıyla doğrulayın
• Yüksek kırılma hacmi bölgeleri sıklıkla KURUMSAL EMİLİM ALANLARI ile örtüşür
🕯️ FİYAT HAREKETİ İLE
• Histogramın önemli DENGESİZLİK gösterdiği bölgelerde MUM FORMASYONLARINI arayın
• Yüksek alım baskısı bölgesinde bir TERSİNE DÖNÜŞ FORMASYONU başarı olasılığı daha yüksektir
🎯 🚀 HIZLI YORUM
Görsel SinyalYorum
📗 Büyük ALIM çubuğu, 📕 küçük satış çubuğu
GÜÇLÜ TALEP BÖLGESİ, muhtemel DESTEK
📕 Büyük SATIŞ çubuğu, 📗 küçük alım çubuğu
GÜÇLÜ ARZ BÖLGESİ, muhtemel DİRENÇ
⚔️ Her iki çubuk da BÜYÜK ve benzer
SAVAŞ BÖLGESİ, YÜKSEK VOLATİLİTE beklenir
⏭️ Çubuksuz Satır
AZ İLGİ BÖLGESİ, fiyat hızla GEÇTİ
ÖNEMLİ HUSUSLAR
• ❌ Gösterge, doğrulanmış tarihsel verilerle çalışır; GELECEĞİ TAHMİN ETMEZ
• 📊 Daha fazla hesaplama çubuğu sayısı = DAHA GENİŞ BAKIŞ ancak YENİ SİNYALLERİ SEYRELTİR
• ⏰ Zaman dilimine göre Salınım Uzunluğunu ayarlayın: Daha yüksek zaman dilimleri için daha yüksek değerler
• 🛡️ Her zaman uygun risk yönetimi ile birleştirin
Özet
Key features include:
- Horizontal lines marking bullish (green) and bearish (red) structure breaks.
- A histogram on the right side of the chart divided into rows representing equal price ranges, showing accumulated volume of bullish and bearish breaks. Larger bars indicate higher volume.
- A grid marking the maximum and minimum price range of the analyzed period, divided into equal sections for easier reading.
The indicator recalculates automatically at the close of each candle, updating with any new structure breaks. Main adjustable parameters include the number of bars analyzed backward, swing length sensitivity for pivot detection, histogram rows, histogram width, and display mode (separated buy/sell or aggregated volume).
Volume Break Structure can be combined with trend analysis, support and resistance levels, order flow tools, and price action patterns to confirm market movements and identify potential entry points. It works with confirmed historical data and does not predict future price action.
Müşteri değerlendirmeleri
5 | 0 % | |
4 | 100 % | |
3 | 0 % | |
2 | 0 % | |
1 | 0 % |


