Descrição
Oscilador Avançado do Canal do Ciclo de Hurst — Descrição do Indicador
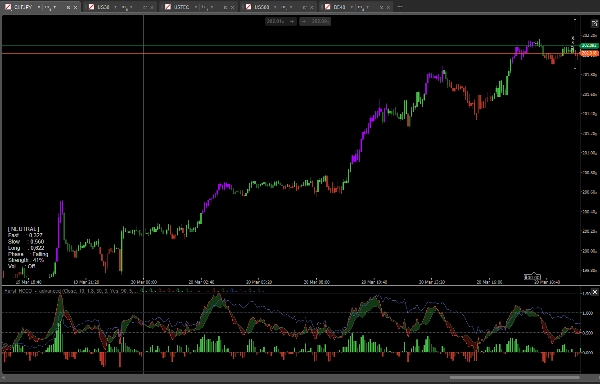
O Oscilador Avançado do Canal do Ciclo de Hurst é um indicador profissional de momentum multiciclo para cTrader baseado nos princípios da teoria do ciclo de Hurst. Em vez de medir o momentum bruto do preço, ele posiciona o preço atual dentro de canais de ciclo calculados dinamicamente, oferecendo aos traders uma visão normalizada de onde o preço se encontra dentro de seu movimento cíclico natural.
Três Camadas de Ciclo
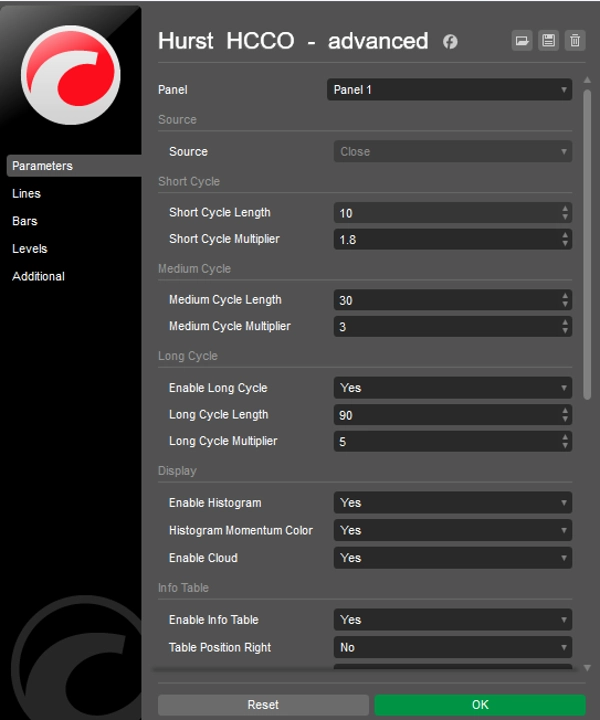
O indicador calcula três canais de ciclo independentes — Curto, Médio e Longo — cada um construído a partir de uma média móvel exponencial centrada dentro de um envelope baseado em ATR. Os ciclos Curto e Médio conduzem o oscilador principal, enquanto o ciclo Longo opcional fornece um contexto de mercado mais amplo. Todos os comprimentos de ciclo e seus multiplicadores ATR são totalmente configuráveis.
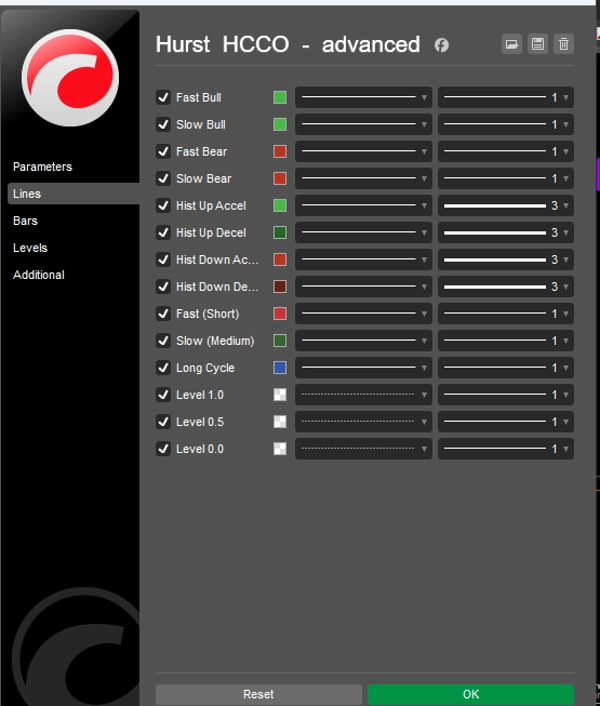
Linhas de Oscilador Rápida e Lenta
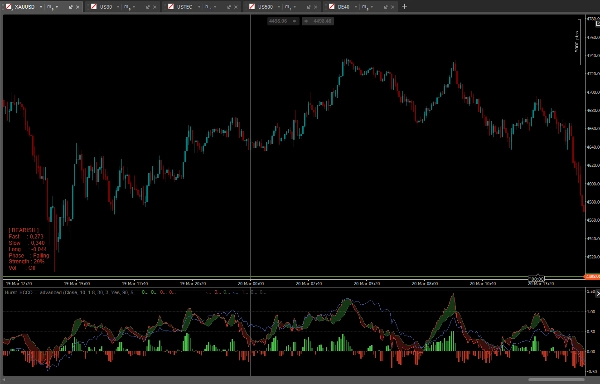
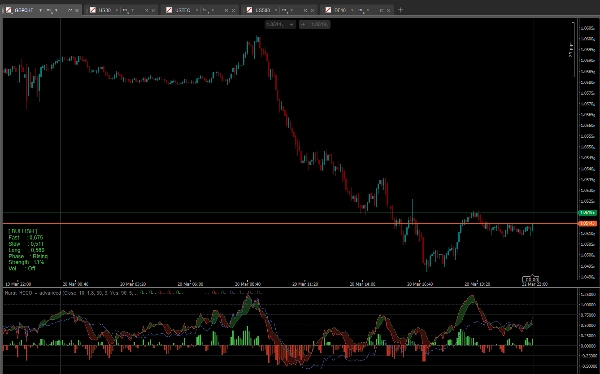
A linha Rápida mostra onde o preço atual está dentro do canal do ciclo Médio — um valor acima de 0,5 significa que o preço está na metade superior do seu ciclo, abaixo de 0,5 significa a metade inferior. A linha Lenta representa o ponto médio do canal do ciclo Curto em relação ao ciclo Médio, atuando como uma referência mais suave. Juntas, elas criam um oscilador de linha dupla semelhante em estrutura ao MACD, mas fundamentado na geometria do ciclo.
Nuvem do Ciclo
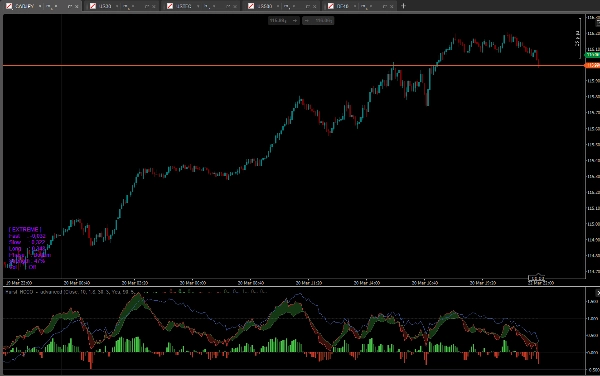
Uma nuvem opcional preenche a área entre as linhas Rápida e Lenta. Uma nuvem verde se forma quando a Rápida está acima da Lenta (viés de ciclo altista), uma nuvem vermelha quando a Rápida está abaixo da Lenta (viés de ciclo baixista). A nuvem torna a relação entre as duas camadas de ciclo instantaneamente legível.
Histograma de Momentum
O histograma plota a diferença entre as linhas Rápida e Lenta com codificação de momentum em quatro cores — aceleração altista, desaceleração altista, aceleração baixista, desaceleração baixista. Isso facilita ver não apenas a direção, mas se o movimento do ciclo está ganhando ou perdendo energia.
Detecção da Fase do Ciclo
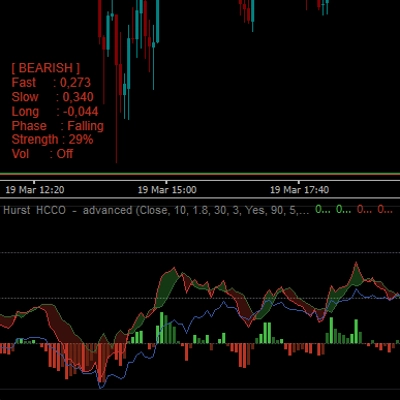
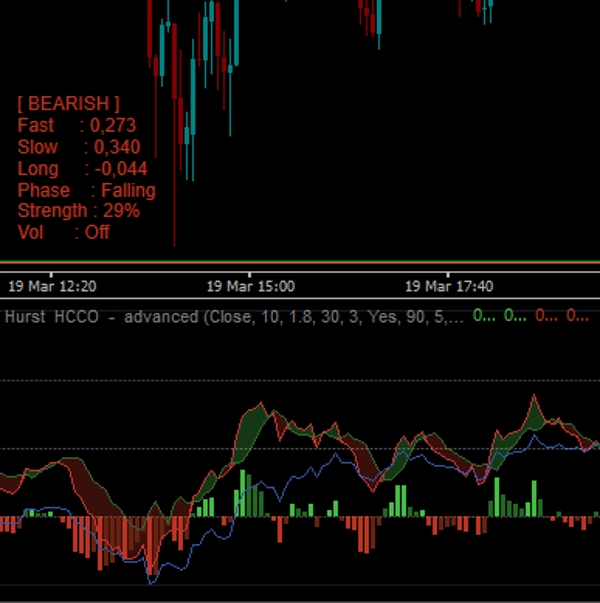
A tabela de informações exibe a fase atual do ciclo: Fundo, Pré-Fundo, Recuperando, Subindo, Enfraquecendo, Pós-Pico, Pico. Essa rotulagem é derivada diretamente do valor do oscilador Rápido e sua direção, dando aos traders uma leitura em linguagem simples de onde o mercado está em seu ciclo.
Força da Tendência
Um lookback configurável calcula uma pontuação normalizada de força da tendência baseada em quão longe a linha Rápida se desvia do ponto médio 0,5. O resultado é mostrado como uma porcentagem na tabela de informações.
Filtro de Volatilidade
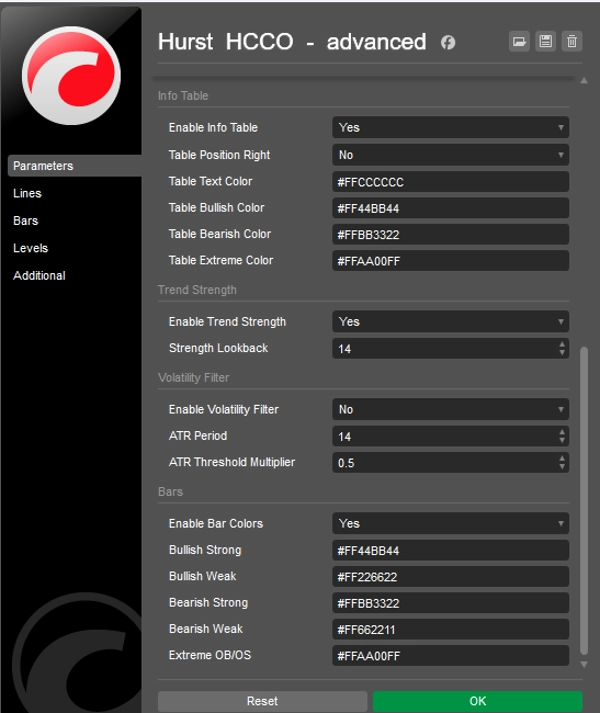
Um filtro de volatilidade opcional baseado em ATR desbota as barras do histograma e as cores das barras quando a volatilidade do mercado cai abaixo de um limite configurável, evitando que o oscilador gere sinais enganosos durante condições de mercado lateral ou instáveis.
Tabela de Informações
Uma tabela compacta no gráfico mostra o estado atual do mercado (Altista, Baixista, Neutro, Extremo), valores dos osciladores Rápido, Lento e Longo, fase do ciclo, porcentagem de força da tendência e status do filtro de volatilidade. Posição e todas as cores são configuráveis.
Coloração das Barras
Quando ativada, as velas do gráfico são coloridas com base no estado do oscilador — forte altista, fraco altista, fraco baixista, forte baixista e sobrecompra/sobrevenda extrema. Leituras extremas ocorrem quando a linha Rápida se move fora do intervalo 0,0–1,0, sinalizando um rompimento de preço além do canal do ciclo.
Resumo das Principais Características
- Três camadas de ciclo configuráveis baseadas na teoria do ciclo de Hurst
- Oscilador duplo Rápido/Lento normalizado para posição no canal do ciclo
- Nuvem do ciclo entre as linhas Rápida e Lenta
- Histograma de momentum em quatro cores
- Detecção automática da fase do ciclo com rótulos em linguagem simples
- Porcentagem de força da tendência em tempo real
- Filtro de volatilidade baseado em ATR
- Tabela de informações no gráfico com detalhamento completo do estado do mercado
- Coloração opcional das velas
- Todas as cores totalmente personalizáveis com suporte a canal alfa
- Sem repintura
Resumo
Avaliações de clientes
5 | 100 % | |
4 | 0 % | |
3 | 0 % | |
2 | 0 % | |
1 | 0 % |


