
Best ATR Indicators for cTrader
Explore ATR indicators that make volatility visible and practical. These indicators and chart tools help estimate typical range, place smarter stops, and adapt position management to changing conditions. Great for building a volatility-aware trading strategy on Forex pairs, gold, and indices—especially when markets shift from quiet ranges to fast moves.
Công cụ
So sánh công cụ
Câu hỏi thường gặp


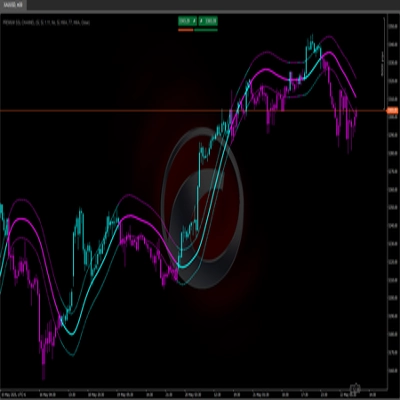
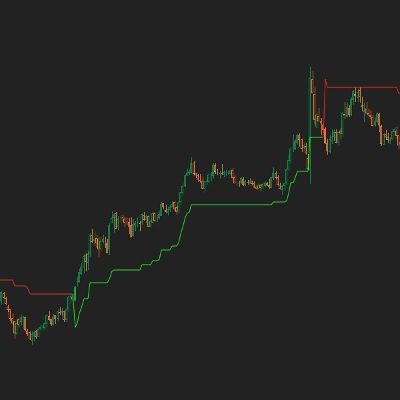

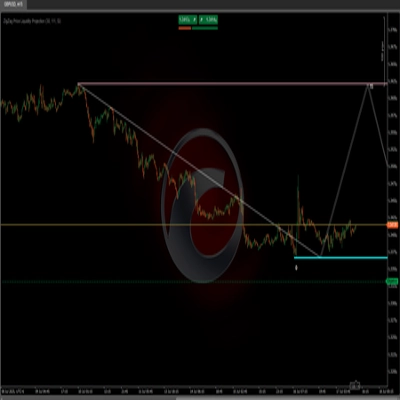






So sánh công cụ
Sản phẩm | Đánh giá | Lượt tải | Lượt bán | Giá | Nền tảng tương thích |
|---|---|---|---|---|---|
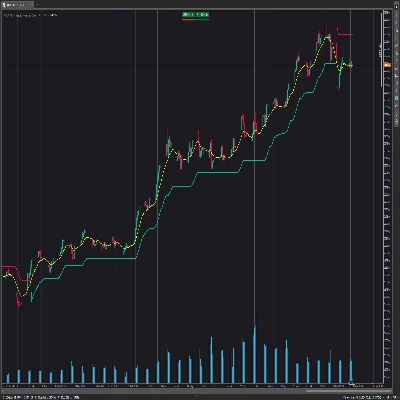
PMAX | 5.0 (6) | 1.76K | — | Miễn phí | Windows, Mac |
UT Bot Alert | 5.0 (5) | — | 13 | $19 | Windows, Mac |
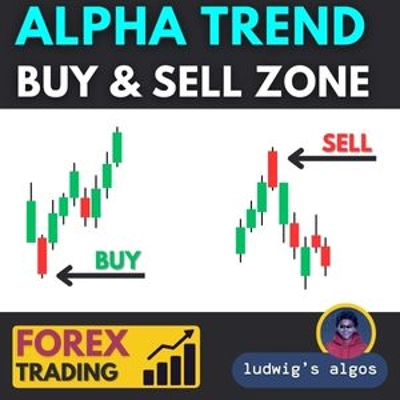
AlphaTrend Pro by LudwigICT | 5.0 (6) | 1.35K | — | Miễn phí | Windows, Mac |
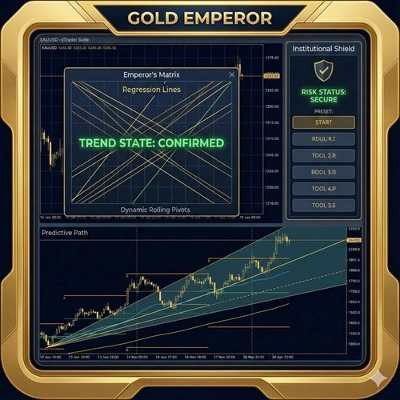
Gold Emperor | 4.8 (4) | — | 11 | $20 | Windows, Mac |
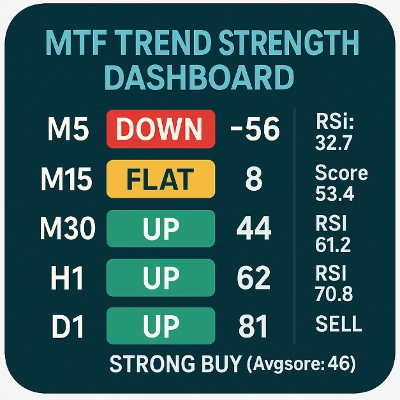
Multi Timeframe Trend Scanner | 4.0 (4) | 948 | — | Miễn phí | Windows, Mac |
ScalpingSignalIndicator | 5.0 (3) | — | 9 | $75 | Windows, Mac |
Market Imbalance | — | 738 | — | Miễn phí | Windows, Mac |
UT Bot Alerts Nova | 4.8 (6) | — | 9 | $19 | Windows, Mac |
Support and Resistance Lite | 4.0 (1) | 627 | — | Miễn phí | Windows, Mac |
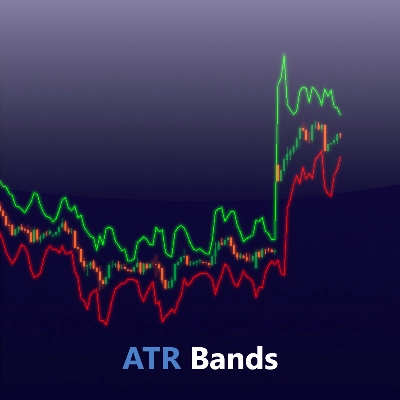
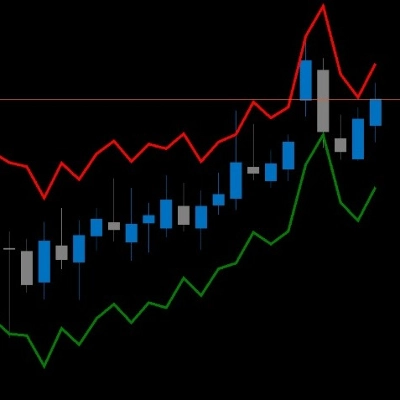
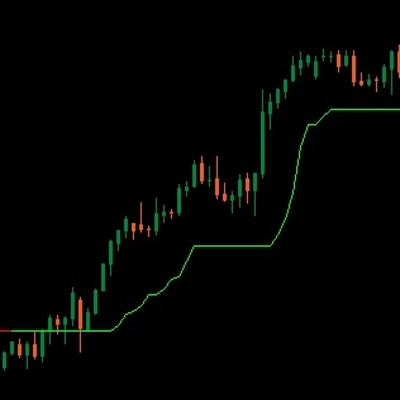
ATR Bands | 4.8 (4) | — | 7 | từ $9 | Windows, Mac |
PREMIUM SSL CHANNEL | 5.0 (1) | 444 | — | Miễn phí | Windows, Mac |
UT Bot | 4.4 (5) | — | 4 | $19 | Windows, Mac |
WeTrade Trendline Breakout | 5.0 (1) | 442 | — | Miễn phí | Windows, Mac |
Zig Zag ATR | 4.0 (2) | — | 3 | $19 | Windows, Mac |
ZigZag Price Liquidity Projection | — | 424 | — | Miễn phí | Windows, Mac |
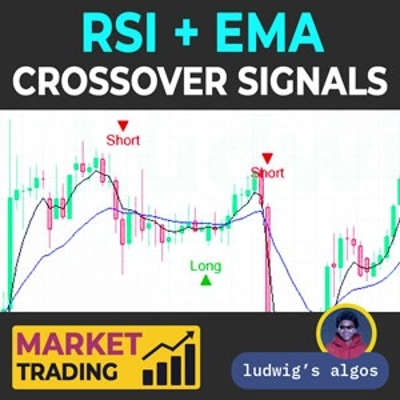
RSI + EMA Crossover Signals | 4.0 (2) | — | 3 | $49 | Windows, Mac |
Prime Trend Targets | 4.0 (1) | 382 | — | Miễn phí | Windows, Mac |
Square Matrix Trading System | 5.0 (3) | — | 3 | $49 | Windows, Mac |
KNN Machine Learning Momentum | — | 309 | — | Miễn phí | Windows, Mac |
AlphaTrend Pro Max | 4.8 (5) | — | 3 | $19 | Windows, Mac |
[Stellar Strategies] Visual Trend Momentum | 5.0 (1) | 302 | — | Miễn phí | Windows, Mac |
SmartBot-Tenkan & ATR Indicator | 4.5 (2) | — | 2 | $19 | Windows, Mac |
ATR on Chart | — | 299 | — | Miễn phí | Windows, Mac |
Dynamic ATR TPSL R-Multiple Helper | 4.6 (5) | — | 2 | $29 | Windows, Mac |
Momentum Trend Analyzer | — | 212 | — | Miễn phí | Windows, Mac |
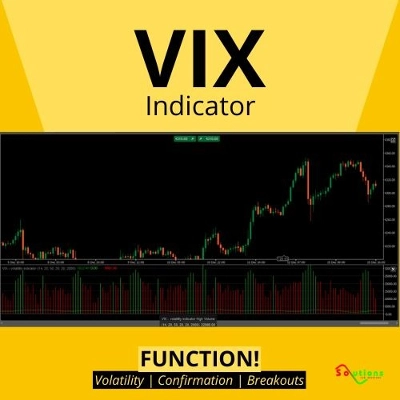
VIX - volatility indicator | 4.7 (3) | — | 2 | $25 | Windows, Mac |
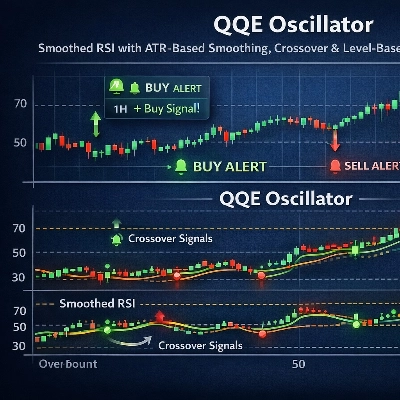
QQE_MTF | 4.0 (1) | 196 | — | Miễn phí | Windows, Mac |
ADT_bigCandles | 4.8 (4) | — | 2 | $20 | Windows, Mac |
[Stellar Strategies] Market Regime Filter | — | 162 | — | Miễn phí | Windows, Mac |
TrendMagicOptimized | 4.5 (4) | — | 1 | $19 | Windows, Mac |
pATR | — | 119 | — | Miễn phí | Windows, Mac |
TradingView ATR | 5.0 (3) | — | — | $19 | Windows, Mac |
SigmaTrend Oscillator | 5.0 (1) | 101 | — | Miễn phí | Windows, Mac |
RISK V1 | 4.7 (3) | — | — | $19 | Windows, Mac |
Advanced SSL Channel | 5.0 (1) | 96 | — | Miễn phí | Windows, Mac |
Indicatore utbot | 5.0 (2) | — | — | $20 | Windows, Mac |
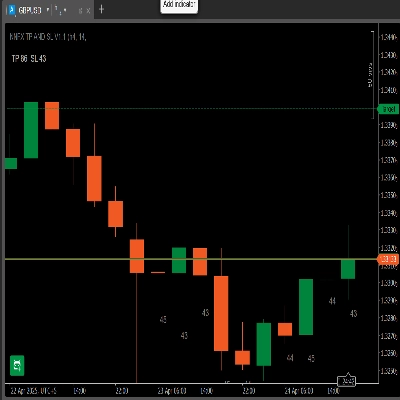
NNFX TP AND SL V1.1 | 4.5 (2) | — | — | $19 | Windows, Mac |
Câu hỏi thường gặp
Average true range (ATR) is the typical size of a bar's full movement, including any gap from the previous close, averaged over a set number of periods. It is expressed in price units, so it shows how far a symbol tends to travel per bar but nothing about direction.
No. An ATR-based stop indicator only draws suggested levels, such as a line a chosen multiple of ATR beyond price, and never sends or edits orders. You move the stop yourself, use cTrader's trailing stop, which follows at a fixed distance, or run a separate cBot coded with volatility rules.
The period, commonly fourteen bars, sets how many bars feed the average: a short one reacts quickly to a burst of volatility, a long one changes slowly. The multiplier scales the distance of any bands or stop lines from price, so a larger value places them further away and a smaller one tighter.
Because ATR is measured in each symbol's own price units, a value on XAUUSD and one on a currency pair describe different scales. Compare a symbol with its own history instead, and remember the line looks backwards: a news spike can arrive before it reacts, and stops sized from it can still be hit.
Check whether a tool adds anything to the raw line, such as stop bands, a daily-range readout or alerts, and look at how often it has been updated. Some ATR tools are free, so you can install a few on cTrader for Windows or Mac and compare them on one chart.