Açıklama
Açıklama
Pinescriptlabs Store göstergeleri: 🤖 Pinescriptlabs Store cBots : (cBot)
Gold & BTC BreakoutOturum Pivotları(yeni)
SmartTrend Destek &
Direnç
Çizgileri
Dinamik
Piyasa Yapısı
Analizi
dönüm noktalarının
Analizi
Fibonacci
Doğrusal
Regresyon
Çok Zamanlı
Çok Katmanlı
Mum Eğilimi
Takipçisi
Otomatik
Destek ve
Direnç
Trend
Çizgileri
Tüm
Destek ve
Direnç
Seviyeleri
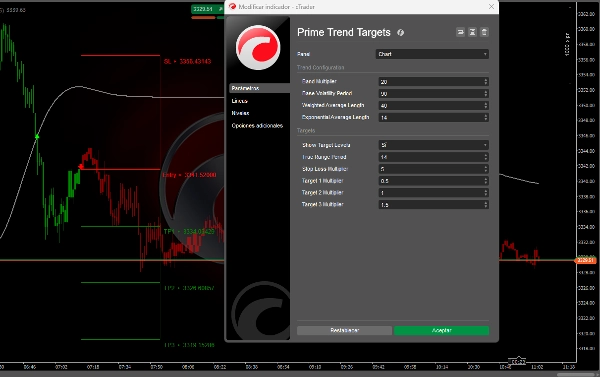
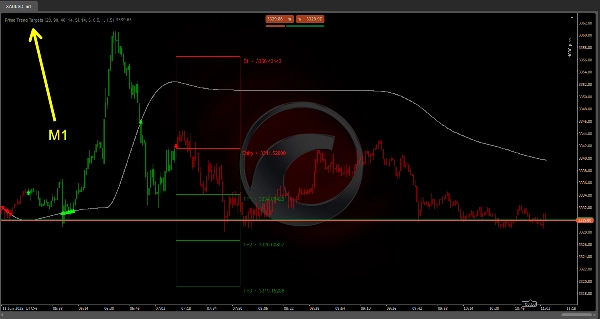
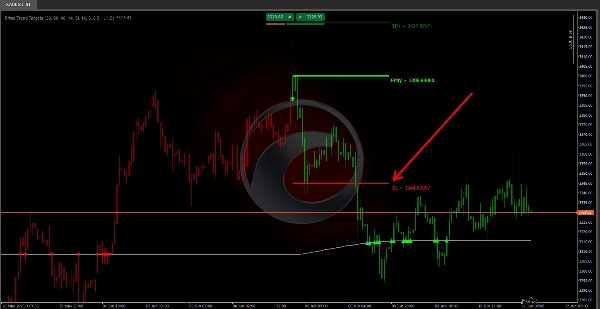
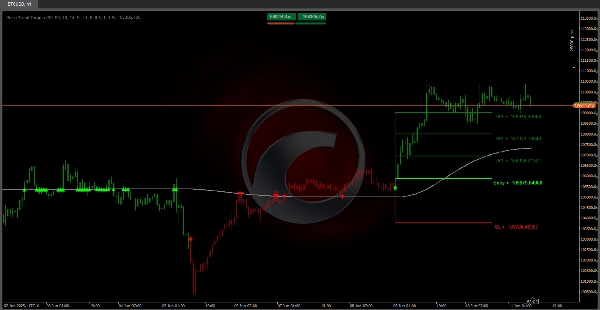
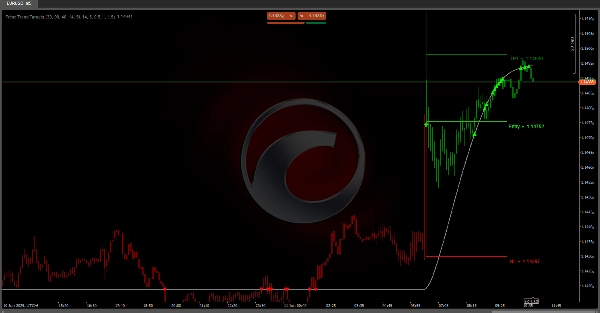
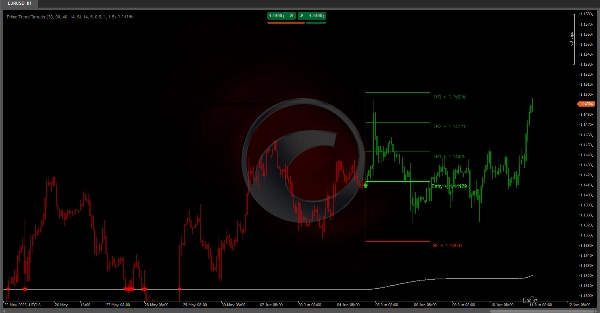
Ana Trend Hedefleri :
sunar düzgünleştirilmiş trend çizgisi dayalı volatilite bantları (ATR) kalıcılık mantığı ile, küçük gürültüyü filtreler. 🔄 Mevcut çizgi değerini önceki ile karşılaştırarak trend dönüşlerini tespit eder ve fiyat çizgiyi tekrar tekrar test ettiğinde reddetme sayısı ile sinyalleri doğrular. ✅ Bir faz kayması onaylandığında, giriş, stop loss ve üçe kadar volatiliteye göre ayarlanmış hedefleri (ATR × çarpanlar) projekte eder, risk/ödül seviyeleri ve bölgeleri grafikte çizer. 🎨 Mumlar kolay okunması için faza göre renklendirilir.
⚙️ Parametre Etkisi
• Daha yüksek hassasiyet vs. sağlamlık:
- 📉 Daha kısa ATR ve düzgünleştirme periyotları dönüşlere daha hızlı tepki verir ancak daha fazla gürültü üretir.
- 📊 Daha uzun periyotlar yanlış sinyalleri düzeltir ancak tespiti geciktirebilir.
- 🔍 Daha büyük çarpanlar bantları ve durdurmaları genişletir, erken sinyalleri azaltır ancak beklenen dönüş gerçekleşmezse gecikme veya kayıpları artırır.
- 🎯 Daha küçük hedefler ılımlı kazançları hızlıca kilitler; daha büyük hedefler uzun hareketleri hedefler ancak isabet olasılığı düşüktür.
• Bütünsel ayar: Varlığınız ve zaman diliminiz için volatilite, bant, düzgünleştirme ve seviye yönetimi ayarlarını birleştirin.
✅Operasyonel Kılavuzlar
• Geri test ve demo testi iyi yapın—farklı koşullar altında (trend, yatay, yüksek/düşük volatilite) farklı kombinasyonları deneyin.
• Diğer analizlerle birleştirin: Destek/direnç, mum formasyonları, hacim veya onaylayıcı göstergeler.
• Risk yönetimi: Sabit risk yüzdesini korumak için pozisyon büyüklüğünü stop mesafesine göre ayarlayın.
• Disiplin ve periyodik gözden geçirme: Geçmiş verilere aşırı uyum sağlamaktan kaçının; piyasa koşulları değiştiğinde ayarlayın.
Özet
Upon confirming a phase shift, Prime Trend Targets projects key trading levels including entry points, stop loss, and up to three volatility-adjusted targets calculated as ATR multiplied by configurable multipliers. These levels are visually represented on the chart as risk/reward zones. Additionally, the indicator colors candles according to the current market phase for easier interpretation.
Users can adjust parameters to balance sensitivity and robustness: shorter ATR and smoothing periods increase responsiveness but may generate more noise, while longer periods reduce false signals but delay detection. Larger multipliers widen bands and stops, reducing premature signals but potentially increasing lag or losses if reversals fail. Target sizes can be set smaller for quicker gains or larger for extended moves with lower hit probability.
The indicator supports holistic tuning by combining volatility, band, smoothing, and level management settings tailored to specific assets and timeframes. Operational guidelines recommend thorough backtesting, combining with other analysis tools, applying risk management, and maintaining discipline with periodic reviews.
Müşteri değerlendirmeleri
5 | 0 % | |
4 | 100 % | |
3 | 0 % | |
2 | 0 % | |
1 | 0 % |


!["High-Low Divergence [Iridio Capital]" logosu](https://cdn.ctrader.com/image/webp/443c4661-7abb-40f1-842f-4b6ec560649b_40914)