
Descripción
Descripción
Indicadores de Pinescriptlabs Store: 🤖Pinescriptlabs Store cBots :
ICT Power of 3 (cBot) Gold & BTC BreakoutSession Pivots(nuevo)YieldShield"
SmartTrend Soporte y
Líneas de Resistencia
Sesiones de Brecha de Valor Justo
Estructura Dinámica del Mercado
Análisis de Puntos de Giro
Fibonacci Lineal
Regresión Multi-temporal
Brecha de Valor Justo de Momentum
Proyección de Flujo de Mercado
Gradiente de Tendencia Dinámico
Sesgo de Vela Multi-Nivel
Rastreador
Rastreador de Extremos Zig-Zag
Soporte Automático y
Líneas de Tendencia de Resistencia
Todos los Niveles de Soporte y
Resistencia
Mapa de Liquidación por Apalancamiento
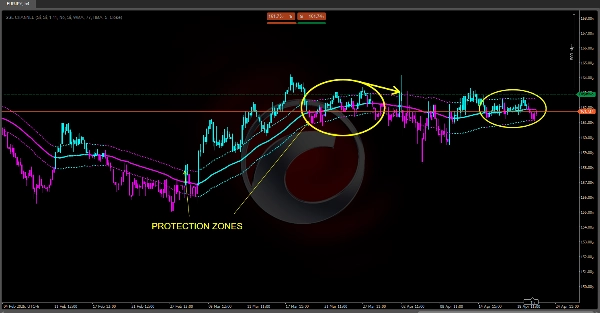
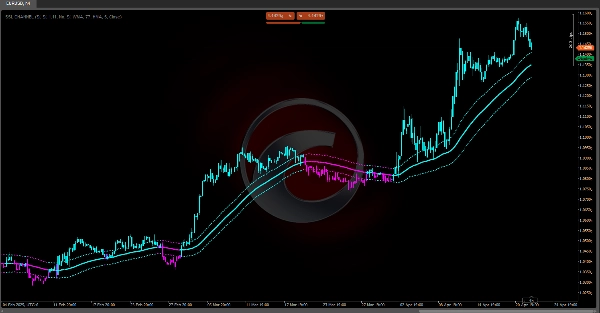
El Canal SSL Premium 🔍
Combina detección de tendencia a través de una media móvil, evaluación de volatilidad con bandas basadas en ATR, y un filtro a corto plazo (SSL) para ofrecer un sistema de análisis integrado. 💡 Su fortaleza radica en la claridad de sus señales visuales y la adaptabilidad en diferentes mercados, mientras que su principal desafío es minimizar el retraso y filtrar movimientos laterales. Con una parametrización adecuada, se convierte en una herramienta poderosa para decisiones de entrada/salida en el trading. 🎯
1. Propósito y Utilidad en Trading 📊
• Detección de tendencia principal: Gracias a una línea central (la "Línea Base"), el indicador muestra la dirección dominante del mercado. 📈📉
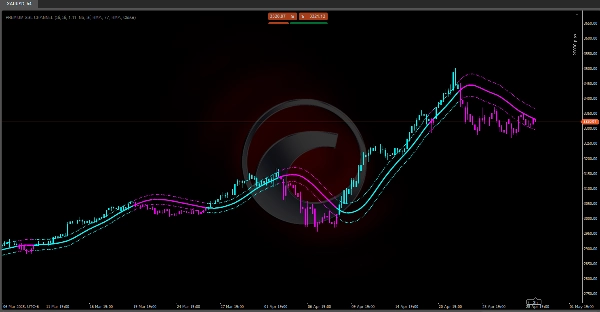
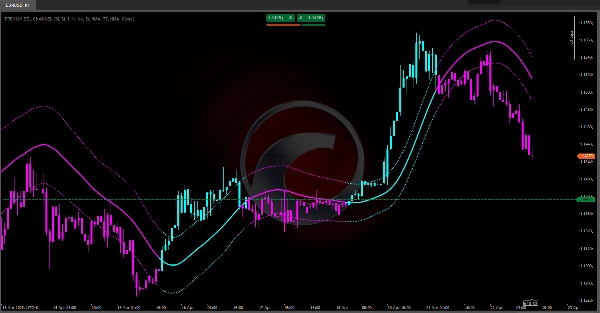
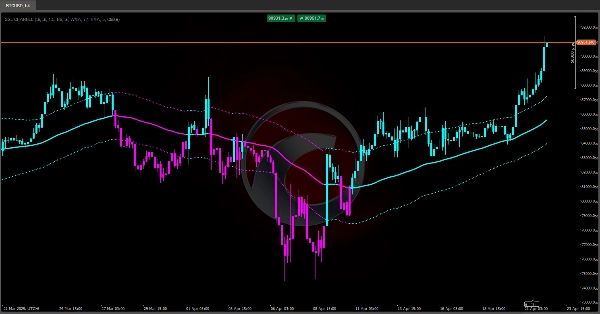
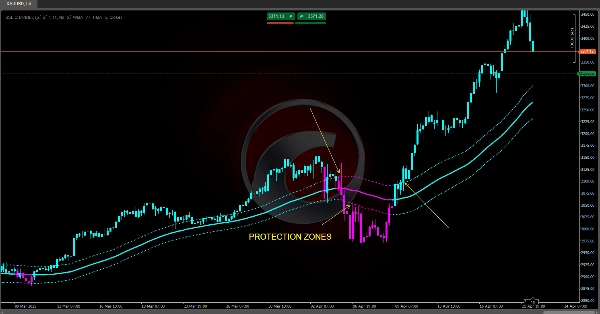
• Medición de volatilidad: Usando un rango promedio (ATR), ajusta dos bandas (por encima/por debajo de la Línea Base) como zonas dinámicas de soporte/resistencia. ⚡
• Filtro de ruido y cambio de sesgo: El canal SSL (una media móvil adaptativa basada en máximos/mínimos) identifica reversiones a corto plazo para entradas/salidas precisas. 🔄
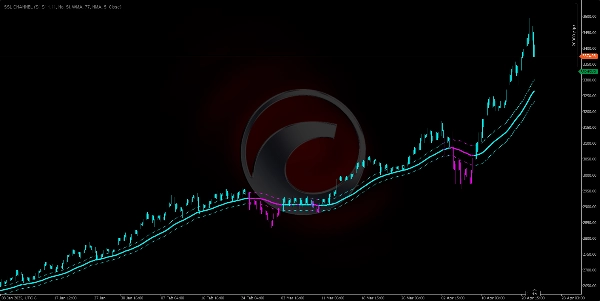
• Visualización intuitiva: Colorea las barras de precio y líneas según el sesgo (cian = alcista, magenta = bajista) para una interpretación instantánea. 🎨
2. Componentes y Lógica Central ⚙️
2.1. Línea Central ("Línea Base")
• Calcula una media móvil de precio (SMA, EMA, WMA o Hull) para suavizar el ruido.
• Representa el valor promedio del mercado, mostrando la tendencia dominante:
- Precio por encima → Tendencia alcista. 🟢
- Precio por debajo → Tendencia bajista. 🔴
2.2. Rango Promedio (ATR)
• Mide la volatilidad real del mercado promediando máximos/mínimos/cierres previos.
• ATR más alto = Más volatilidad; ATR más bajo = Mercados más tranquilos. 🌊
2.3. Bandas Dinámicas ("ATR Superior" y "ATR Inferior")
• ATR Superior = Línea Base + (ATR × Multiplicador)
• ATR Inferior = Línea Base – (ATR × Multiplicador)
• Actúa como canales de precio:
- Precio tocando banda superior → Fuerza alcista. 🚀
- Precio cerca de banda inferior → Momentum bajista. 🐻
2.4. Canal SSL (Línea de Señal Suavizada)
• Usa medias móviles en máximos/mínimos por separado.
• Lógica de dirección:
- Cierre por encima de la media móvil alta → Sesgo alcista. ✅
- Cierre por debajo de la media móvil baja → Sesgo bajista. ❌
- Entre medias → Se mantiene el sesgo previo.
• Actúa como un filtro de tendencia a corto plazo, confirmando o contradiciendo la Línea Base. 🔄
3. Generación de Señales y Uso Práctico 🛠️
1. Confirmación de Tendencia
- Alcista Fuerte: Precio > ATR Superior. 🟢
- Alcista Moderado: ATR Superior > Precio > Línea Base.
- Bajista Moderado: Línea Base > Precio > ATR Inferior.
- Bajista Fuerte: Precio < ATR Inferior. 🔴
2. Filtro SSL
- Entradas: Solo ir en largo si SSL está por encima de su línea (o en corto si está por debajo). ⬆⬇
- Salidas: Salida parcial/total cuando SSL revierte y cruza la media móvil alta/baja opuesta. ✋
3. Coloreado de Barras
- Las barras de precio se vuelven cian (alcista) o magenta (bajista), sincronizadas con la Línea Base para lecturas rápidas del mercado. 🎨
4. Parámetros Configurables e Impacto ⚖️
• Periodo de la Línea Base: Más largo = más suave pero con retraso; más corto = más sensible pero ruidoso. 🐢⚡
• Multiplicador de Banda: Más alto = canal más ancho (menos señales falsas); más bajo = más estrecho (más señales, más falsas alarmas). ↔️
• Tipo de MA (SMA/EMA/WMA/HMA): Afecta el peso de precios recientes vs. históricos. 📅
• Periodo y Tipo de SSL: Define la sensibilidad del filtro a corto plazo. 🎚️
Resumen
Valoraciones de clientes
5 | 100 % | |
4 | 0 % | |
3 | 0 % | |
2 | 0 % | |
1 | 0 % |


