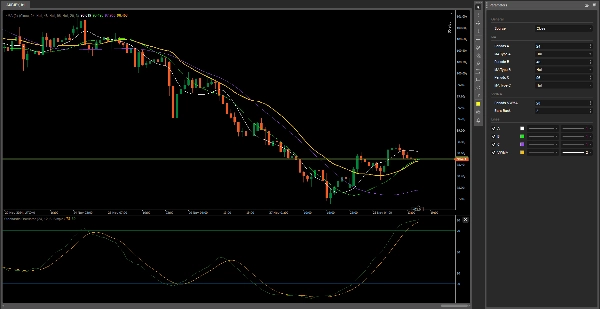
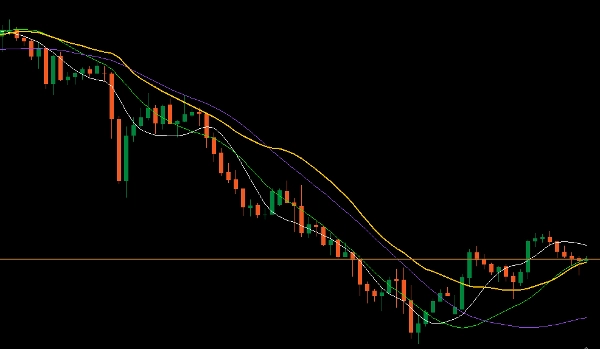
Logo de "4MA"
4MA
5.0
Avis : 1
Image mise en ligne de "4MA"
135
Ventes
10.58K
Installations gratuites

This indicator consists of 3 moving averages that can be configured to your liking, from the type of moving average to its colors, thickness, and line type.

The fourth is VWMA (Volume-Weighted Moving Average) – the typical formula for this indicator is - 3-day VWMA = (C1 * V1 + C2 * V2 + C3 * V3) / (V1 + V2 + V3).

In this option, I have created the possibility to repeat the interval not just 3 times but up to 500 times.

I created this to keep the chart clean.

The default parameters are moving average hull which are perfect and periods 24, 48, 96 are more optimal for me in each timeframe.

Additional

These are the tools that help me earn money

https://ctrader.com/products/3441?u=Thomas-Sparrow

https://ctrader.com/products/526?u=Thomas-Sparrow

https://ctrader.com/products/3137?u=Thomas-Sparrow

https://ctrader.com/products/2913?u=Thomas-Sparrow

You will be invincible

Good luck 😀

Profil de l'indicateur
5.0
Avis : 1
5
100 %
4
0 %
3
0 %
2
0 %
1
0 %
Avis clients
August 12, 2025
Pros: Displays up to four moving averages with full customization. Clean visualization and stable performance. Cons: No alerts or tooltips. Doesn’t support saving user templates. Lacks built-in crossover notifications.
Prop
Forex
Indices
Commodities
Crypto
Stocks
Les produits disponibles sur cTrader Store, notamment les bots de trading, les indicateurs et les plug-ins, sont fournis par des développeurs tiers et mis à disposition à titre informatif et à des fins d'accès technique uniquement. cTrader Store n'est pas un courtier et ne fournit aucun conseil en investissement, aucune recommandation personnelle ni aucune garantie quant aux performances futures.

Plus de cet auteur

Logo de "VWAP-Free"
5.0
(2)
Gratuit
VWAP only timeframe
😎Read the description before purchasing💩
This bot can automatically generate buy and sell orders based on three specific Fixed bugs.
This technical analysis indicator provides information on market sentiment, trend and price levels....
Logo de "AllPattern"
5.0
(2)
Gratuit
🔍 Discover All Candlestick Patterns… Absolutely Free!
😎Read the description before purchasing💩
Session One is a tool for marking from to, useful if you've set the hours you want to trade
With this Fibonacci retracement indicator, traders have full control over the retracement levels displayed on the chart.
The Parabolic SAR, or "Stop and Reverse," is a dynamic technical analysis tool.
A straightforward yet effective tool signals entry points for both buying and selling. Include 3 Moving Average
a visually very powerful tool for analyzing "opposing forces".
🚀 HAI QUANTUM v4.0 | The Ultimate Quantum Terminal for cTrader (Smart Money & Algorithmic Trading)

Vous pourriez aussi aimer

Free Volume Profile v2.0
VWAP Set to London Open
📊 ZigZag Liquidity Projection: Predict bounces/breaks using pivots, ATR & volume.
Delta Peak Bubbles is a tick‑chart overlay for cTrader that highlights the strongest momentum spikes.
Cursor Price Info - A real-time information panel that displays key metrics when you hover over the chart
Auto-swing detection driving 7 Fibonacci projections: retracement, expansion, fan, time, pitchfork, channel, Gann.
Trend & Volume Regime Map – A normalized price & volume regime map for cTrader that scores trend from –10 to +10, colors
Universal Renko Overlay. Tick-Accurate Renko Bars Aligned with Futures Contract Specifications.
Multi-timeframe ATR, smart swap calculator, range analysis all in one professional panel.
Automatic Elliott Wave Detection with Professional Filters
Flexible Volume Profile, designed with performance in mind.
Learn candlestick patterns with live signals, objective rules, context notes, and an interactive quiz training mode.
Smart Money Concepts (SMC)
🌟 HTF indicator for cTrader! Real-time higher timeframe candles (1W-1H) on your chart.
Identifies market imbalances and visually marks key areas based on price patterns and volatility (ATR).
Volumen Delta", es una representación visual del flujo de órdenes basada en el volumen de transacciones.
Price Action Zone shows previous D/W/M key levels to help frame intraday price action, liquidity, and market structure.
Premium Discount Zones" spots key areas (🟣Premium/🟢Discount) using recent highs/lows & volume..............
135
Ventes
10.58K
Installations gratuites