
Deskripsi
📊 NILAI HARAPAN VPOC MONTE CARLO
https://chartshots.spotware.com/c/69c558e2c68df
Analisis Pasar Terpadu: Profil Volume + Proyeksi Statistik 🎯
🎯 APA ITU?
Nilai Harapan VPOC Monte Carlo adalah indikator analisis kuantitatif yang menggabungkan dua metodologi trading profesional:
- Profil Kedalaman Pasar (VPOC) - Mengidentifikasi di mana volume benar-benar terkonsentrasi 🏦
- Simulasi Monte Carlo - Memproyeksikan skenario masa depan berdasarkan probabilitas statistik 📈
Hasilnya adalah sistem analisis yang memberi tahu Anda di mana uang berada (Titik Kontrol) dan kemana kemungkinan akan pergi (Nilai Harapan yang diproyeksikan) 🧠
⚙️ BAGAIMANA CARA KERJANYA?
Modul 1: Profil Kedalaman (VPOC) 📊
Indikator menganalisis 200 bar terakhir (dapat dikonfigurasi) dan mendistribusikan volume ke 30 level harga. Ini menghitung:
- Titik Kontrol (PoC): Harga dengan volume perdagangan tertinggi - mewakili konsensus pasar di mana pembeli dan penjual paling aktif ⚖️
- Delta: Perbedaan antara tekanan beli dan jual di setiap level 🔄
- Heatmap: Visualisasi konsentrasi aktivitas 🔥
Logikanya: Harga cenderung kembali ke PoC karena di situlah sebagian besar likuiditas tertunda berada. Jika harga jauh dari PoC, ada probabilitas lebih tinggi untuk kembali 🔄
Modul 2: Proyeksi Statistik (Monte Carlo) 🎲
Menggunakan simulasi stokastik (1.000 iterasi secara default) untuk memproyeksikan harga masa depan:
- Menghitung tren historis aset dan volatilitas tahunan 📉📈
- Menghasilkan jalur acak menggunakan distribusi normal (model gerak Brown geometrik) 🌊
- Memperkirakan Nilai Harapan dengan pita deviasi standar (±1 sigma) 📏
Rumus yang diterapkan: - Drift per bar = Pengembalian tahunan / hari perdagangan 🧮
- Volatilitas per bar = Volatilitas tahunan / √hari ⚡
- Proyeksi = Harga saat ini × e^(total drift + acak normal × total volatilitas) 🔢
Modul 3: Sinergi 🔗
Menggabungkan kedua analisis untuk menghasilkan sinyal kontekstual:
Tabel
Kondisi Sinyal Arti
BULLISH ↑ 🟢 Harga > PoC + Proyeksi positif Tren bullish dikonfirmasi oleh volume
BEARISH ↓ 🔴 Harga < PoC + Proyeksi negatif Tren bearish dikonfirmasi oleh volume
KESEMPATAN ★ 💡 Harga < PoC + Proyeksi positif Kemungkinan pantulan dari dukungan volume
DIVERGENSI ⚠️ ⚠️ Harga > PoC + Proyeksi negatif Peringatan kemungkinan pembalikan
📈 UNTUK APA INI DIGUNAKAN?
✅ Mengidentifikasi level volume kunci - PoC berfungsi sebagai magnet harga 🧲
✅ Memperkirakan probabilitas keberhasilan - Persentase skenario menang dalam simulasi 🏆
✅ Mengevaluasi risiko/imbalan - Rasio Sharpe dan deviasi standar yang diproyeksikan 📊
✅ Mengonfirmasi arah perdagangan - Sinergi antara posisi relatif terhadap PoC dan momentum statistik 🎯
✅ Proyeksi target - Level harga yang diharapkan untuk periode tahan yang ditentukan 🎯
🎮 KONFIGURASI DAN PENGGUNAAN
Parameter Utama:
Tabel
Grup Parameter Default Deskripsi
Periode Analisis Profil Kedalaman 200 bar Riwayat untuk menghitung profil volume
Level Harga 30 Resolusi profil (lebih banyak level = lebih detail) 🔍
Offset Horizontal 5 Posisi profil pada grafik 📏
Durasi Operasi Maks Proyeksi Statistik 252 bar Horizon waktu proyeksi ⏱️
Modal Investasi $1,000 Dasar untuk perhitungan moneter 💰
Simulasi 1,000 Jumlah jalur acak (lebih banyak = lebih akurat, lebih lambat) 🔄
Tingkat Bebas Risiko 5% Untuk perhitungan Rasio Sharpe 📉
Strategi Historis Gunakan TP/SL Tidak Aktifkan untuk simulasi dengan target tetap 🎯
Cara Menginterpretasi Tabel Hasil:
plain
Copy
STATISTIK NILAI HARAPAN
┌──────────────┬─────────┬─────────┬─────────┬────────┐
│ Metode │ $ Jumlah│ % Pengembalian│ Tingkat Menang│ Sharpe │
├──────────────┼─────────┼─────────┼─────────┼────────┤
│ Historis │ -$19.56 │ -1.96% │ 47.2% │ -1.24 │
│ Simulasi │ -$54.05 │ -5.40% │ 21.4% │ -4.95 │
└──────────────┴─────────┴─────────┴─────────┴────────┘
- Historis: Rata-rata kinerja perdagangan serupa di masa lalu 📜
- Simulasi: Hasil rata-rata dari 1.000 simulasi Monte Carlo 🎲
- Tingkat Menang: Persentase skenario dengan hasil positif ✅
- Sharpe: Pengembalian yang disesuaikan dengan risiko (lebih dari 1 bagus, negatif buruk) 📈
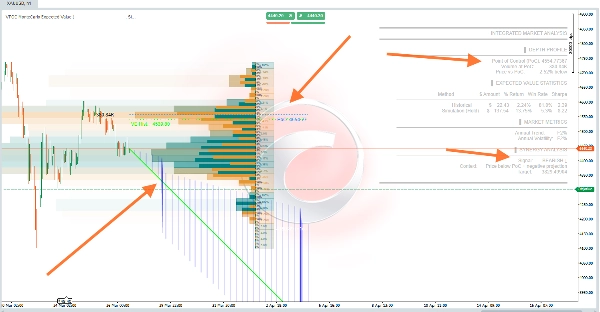
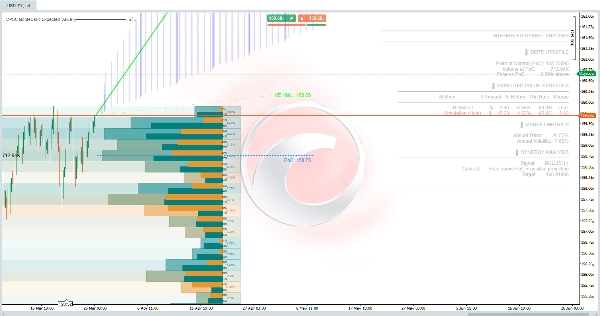
🖼️ Elemen Visual pada Grafik
Tabel
Elemen Warna Arti
Profil volume Gradasi oranye/biru Konsentrasi aktivitas berdasarkan level harga 🎨
Garis PoC Titik-titik biru Titik Kontrol yang diproyeksikan ke masa depan 🔵
Garis proyeksi EV Hijau/Magenta Trajektori harga yang diharapkan 🟢🔴
Pita ±1σ Garis putus-putus putih Rentang kepercayaan 68% 📊
Garis EV historis Garis putus-putus hijau Nilai harapan berdasarkan data historis 🟢
Zona proyeksi Isian biru tembus pandang Area probabilitas antara pita 🔵
⚠️ PENTING - Batasan
- Bukan sinyal beli/jual - Ini adalah alat analisis probabilistik 🛠️
- Simulasi Monte Carlo mengasumsikan distribusi historis berlaku (tidak memprediksi peristiwa angsa hitam) 🦢❌
- PoC bersifat dinamis - Menghitung ulang pada setiap bar baru 🔄
- Memerlukan riwayat yang cukup - Minimal 252 bar untuk proyeksi yang andal 📊
- Cryptocurrency - Indikator secara otomatis menyesuaikan ke 365 hari perdagangan tahunan dibandingkan 252 untuk pasar tradisional 🪙
💡 Strategi Penggunaan yang Direkomendasikan
- Cari KESEMPATAN ★ 💡 - Harga di bawah PoC tetapi dengan proyeksi positif (kemungkinan undervaluasi)
- Konfirmasi dengan Tingkat Menang > 50% - Probabilitas keberhasilan statistik lebih tinggi ✅
- Hindari DIVERGENSI ⚠️ ⚠️ - Harga overvalued relatif terhadap volume aktual
- Gunakan PoC sebagai referensi - Stop atau target di sekitar level likuiditas ini 🎯
- Bandingkan Historis vs Simulasi - Jika sangat berbeda, rezim pasar sedang berubah 🔄
Ringkasan
Using Monte Carlo simulations with default 1,000 iterations, it projects future price scenarios based on historical trends and volatility, applying a geometric Brownian motion model. This generates expected price trajectories with confidence bands (±1 standard deviation), estimating probabilities of success, risk-adjusted returns (Sharpe ratio), and potential target levels.
The combined analysis produces contextual signals such as Bullish, Bearish, Opportunity, and Divergence, based on price relation to PoC and projection direction. It supports various markets including Forex, stocks, commodities, indices, and cryptocurrencies, adjusting parameters like trading days accordingly.
Key configurable settings include analysis period, profile resolution, simulation count, and risk-free rate. Visual elements on the chart display volume profiles, PoC lines, expected value projections, and confidence intervals. The tool is designed for probabilistic market assessment and trade confirmation rather than direct buy/sell signals.


