
Mô tả
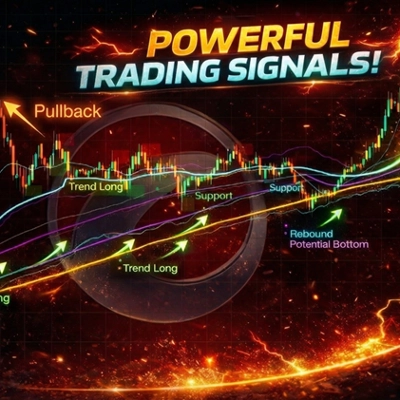
Trend SR System là một chỉ báo biểu đồ theo xu hướng được thiết kế để giúp các nhà giao dịch xác định bối cảnh thị trường, cấu trúc EMA chính, các mức hỗ trợ/kháng cự động và các vùng tiềm năng tiếp tục hoặc hồi quy trung hạn một cách rõ ràng hơn.
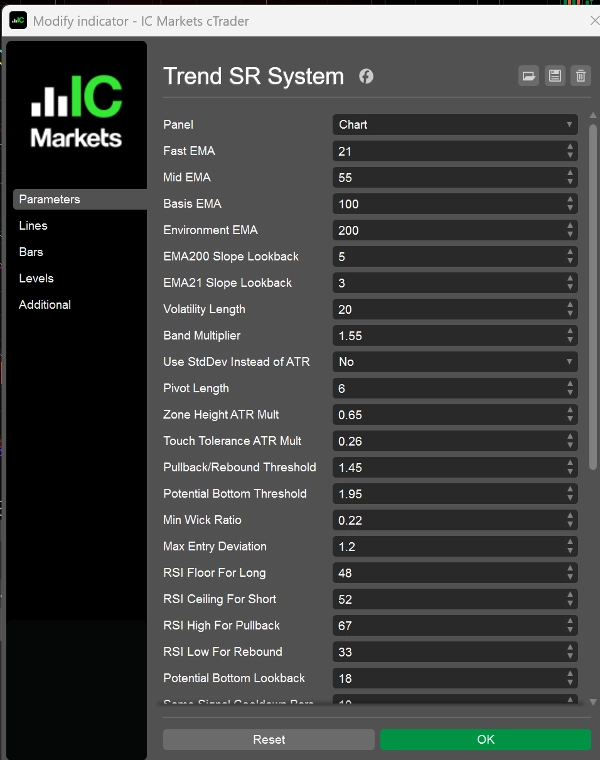
Chỉ báo được xây dựng dựa trên EMA21, EMA55, EMA100 và EMA200:
- EMA200 được sử dụng như bộ lọc môi trường thị trường cấp cao hơn
- EMA100 đóng vai trò là trục giá trung tâm và đường cơ sở của dải băng
- EMA55 giúp xác định áp lực hỗ trợ và kháng cự trung hạn
- EMA21 được dùng để theo dõi nhịp ngắn hạn, các đợt hồi và điều chỉnh
Ngoài ra, chỉ báo kết hợp các dải biến động, các vùng cấu trúc dựa trên pivot và logic hỗ trợ/kháng cự động theo kiểu bước để cung cấp cái nhìn có cấu trúc hơn về thị trường.
Các Tính Năng Chính
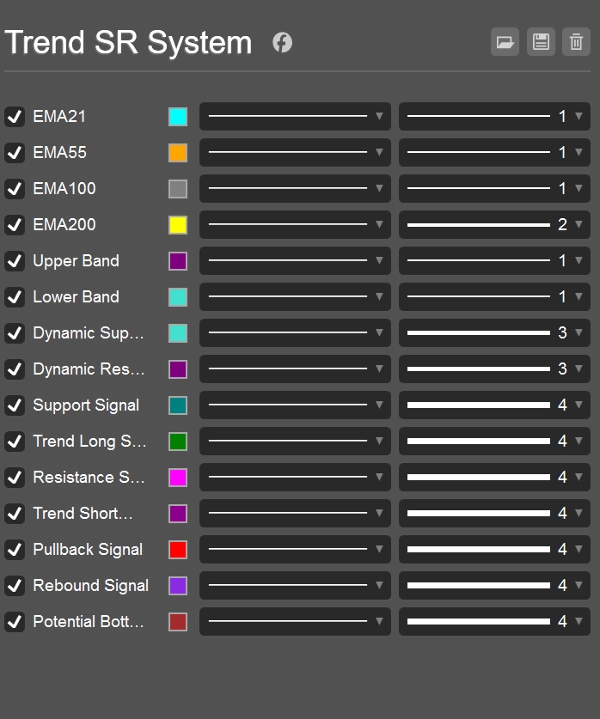
- Hiển thị 4 đường cấu trúc EMA chính
- Hiển thị các dải trên và dưới dựa trên ATR hoặc độ lệch chuẩn
- Tạo ra các mức hỗ trợ và kháng cự động
- Phát hiện các khu vực hỗ trợ/kháng cự cấu trúc bằng logic pivot
- Cung cấp các tín hiệu kiểu tiếp tục và hiệu chỉnh ngắn hạn
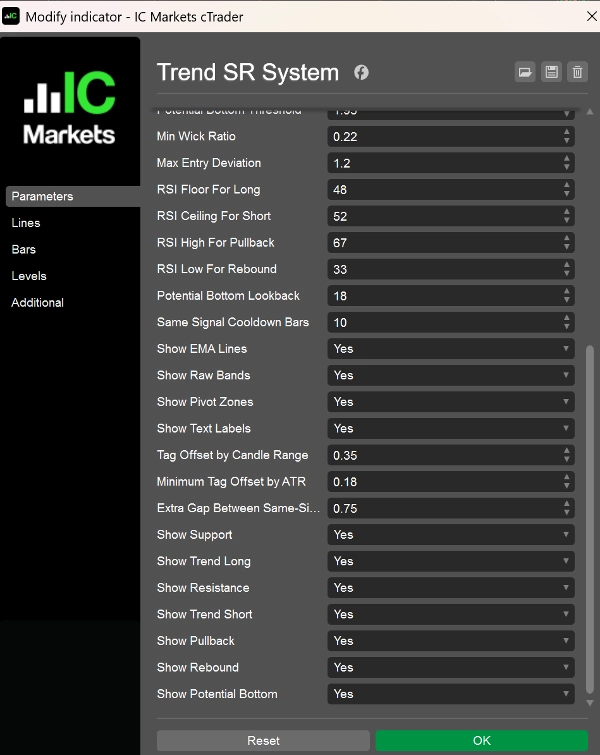
- Cho phép bật hoặc tắt từng loại tín hiệu riêng biệt
Các Loại Tín Hiệu
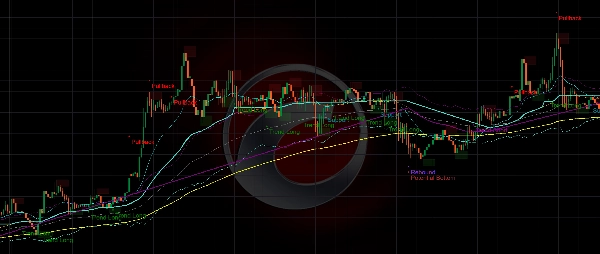
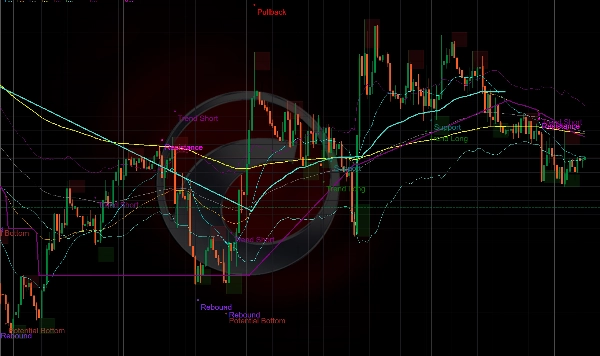
- Hỗ Trợ
Một khu vực hỗ trợ chính trong môi trường tăng giá, cho thấy giá đang được bảo vệ sau một đợt hồi. - Trend Long
Tín hiệu mua theo xu hướng trong thị trường tăng, thường xuất hiện sau khi đợt hồi phục tiếp tục đà tăng. - Kháng Cự
Một khu vực kháng cự chính trong môi trường giảm giá, cho thấy giá đang bị giới hạn sau một đợt điều chỉnh. - Trend Short
Tín hiệu bán theo xu hướng trong thị trường giảm, thường xuất hiện sau khi đợt hồi phục mất sức và xu hướng giảm tiếp tục. - Pullback
Cảnh báo quá mua ngắn hạn trong môi trường tăng giá, cho thấy nguy cơ có thể xảy ra đợt hồi hoặc tích lũy. - Rebound
Cảnh báo quá bán ngắn hạn trong môi trường giảm giá, cho thấy nguy cơ có thể xảy ra đợt hồi kỹ thuật. - Đáy Tiềm Năng
Tín hiệu phục hồi mạnh hơn khi quá bán, nhấn mạnh khả năng hình thành đáy tạm thời.
Các Trường Hợp Sử Dụng Điển Hình
Chỉ báo này phù hợp cho:
- Phân tích theo xu hướng
- Thời điểm vào lệnh khi có đợt hồi và điều chỉnh
- Quan sát cấu trúc EMA và hỗ trợ/kháng cự
- Theo dõi các điều kiện tăng hoặc giảm quá mức
- Lọc giao dịch dựa trên biểu đồ và hỗ trợ quyết định tùy ý
Có thể sử dụng trên forex, chỉ số, kim loại, tiền điện tử và các thị trường theo xu hướng khác.
Phù Hợp Nhất Cho
Chỉ báo này được thiết kế cho các nhà giao dịch:
- Muốn có cái nhìn biểu đồ rõ ràng và có cấu trúc hơn
- Tập trung vào tiếp tục xu hướng và các vùng phản ứng chính
- Sử dụng cấu trúc EMA cùng với hành vi giá và hỗ trợ/kháng cự
- Ưa thích hỗ trợ giao dịch trực quan cho các thiết lập ngắn đến trung hạn
Lưu Ý Sử Dụng
- Tốt nhất nên sử dụng cùng với bối cảnh thị trường và quản lý rủi ro hợp lý
- Các tín hiệu không nên được coi là lời khuyên giao dịch độc lập
- Chất lượng tín hiệu có thể giảm trong điều kiện thị trường biến động mạnh hoặc thấp
- Đây là công cụ phân tích biểu đồ và hỗ trợ giao dịch, không phải hệ thống đảm bảo hiệu suất
Tóm tắt
AI summary
Trend SR System is a trend-focused trading indicator that integrates four key exponential moving averages (EMA21, EMA55, EMA100, EMA200) with volatility bands and dynamic support/resistance levels. EMA200 serves as a higher-level market environment filter, EMA100 as the central price axis, EMA55 to identify medium-term support/resistance pressure, and EMA21 to track short-term price rhythm and pullbacks. The indicator overlays volatility bands based on ATR or standard deviation and uses pivot-based logic to detect structural support and resistance zones.
It provides multiple signal types including support, resistance, trend-following longs and shorts, pullback warnings, rebounds, and potential bottom formations. These signals assist in identifying continuation setups and short-term mean-reversion opportunities. Users can enable or disable individual signal types according to their preferences.
Designed for use across forex, indices, commodities, metals, cryptocurrencies, and other trending markets, the Trend SR System supports trend-following analysis, entry timing on pullbacks, and monitoring of EMA structure alongside price behavior. It is intended as a chart analysis and trade support tool to enhance visual clarity of market context and key reaction zones, best used in conjunction with sound risk management and broader market analysis.
It provides multiple signal types including support, resistance, trend-following longs and shorts, pullback warnings, rebounds, and potential bottom formations. These signals assist in identifying continuation setups and short-term mean-reversion opportunities. Users can enable or disable individual signal types according to their preferences.
Designed for use across forex, indices, commodities, metals, cryptocurrencies, and other trending markets, the Trend SR System supports trend-following analysis, entry timing on pullbacks, and monitoring of EMA structure alongside price behavior. It is intended as a chart analysis and trade support tool to enhance visual clarity of market context and key reaction zones, best used in conjunction with sound risk management and broader market analysis.
Hồ sơ chỉ báo
Danh mục chỉ báo
Xu hướng
Loại đầu ra
Tín hiệu
Yêu cầu dữ liệu
Chỉ dữ liệu nến
Tín hiệu được hỗ trợ
Đảo chiều
Phá vỡ giá
Sức mạnh xu hướng
Đánh giá của khách hàng
4.0
Đánh giá: 3
5 | 0 % | |
4 | 100 % | |
3 | 0 % | |
2 | 0 % | |
1 | 0 % |
Đánh giá của khách hàng
April 9, 2026
a quiet demo run gives a better read. The chart idea becomes easier to explain.
April 8, 2026
April 5, 2026
Thảo luận
Câu hỏi thường gặp
Prop
Forex
Signal
Indices
Supertrend
Commodities
RSI
Crypto
Stocks
ATR
Các sản phẩm có sẵn trên cTrader Store, bao gồm bot giao dịch, chỉ báo và plugin, được cung cấp bởi các nhà phát triển bên thứ ba và chỉ nhằm mục đích cung cấp thông tin và tiếp cận kỹ thuật. cTrader Store không phải là nhà môi giới và không cung cấp lời khuyên đầu tư, khuyến nghị cá nhân hay bất kỳ đảm bảo nào về hiệu suất trong tương lai.
Sản phẩm khác của tác giả này


















Giá
Kể từ 25/03/2026