
说明
用精确的回归数学将价格混乱转化为清晰的趋势通道。
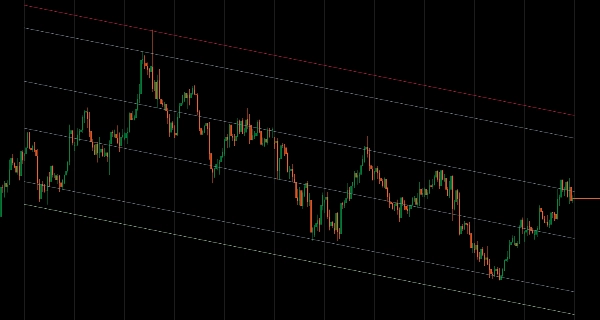
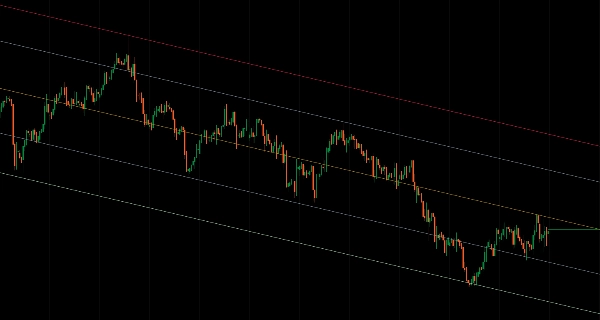
回归通道通过您选择的价格数据计算线性回归线,并根据价格偏差绘制上下边界——为您提供基于统计的趋势方向和潜在反转区域视图。
适用人群
- 寻求客观趋势定义的结构交易者
- 识别超买/超卖极端的均值回归交易者
- 发现通道突破和动量变化的突破交易者
- 多时间框架分析——在日线图上绘制月度回归以提供背景
主要特点
- 灵活的数据选择
-
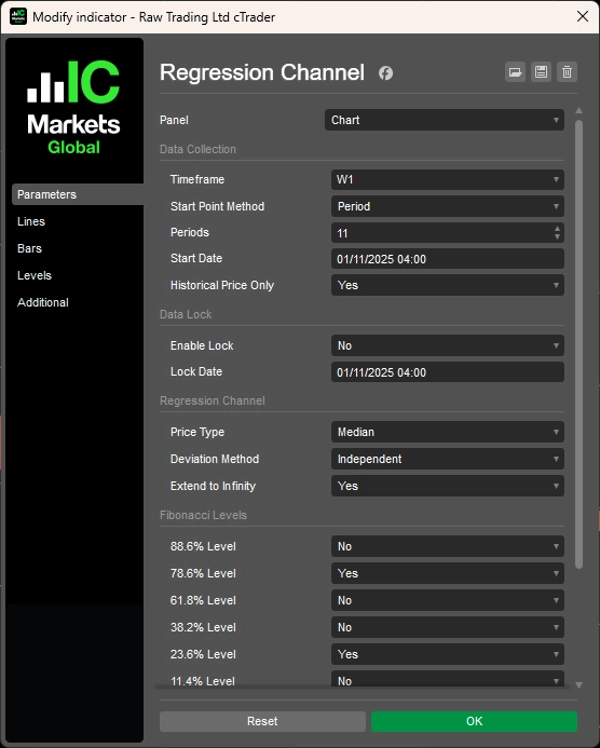
- 周期模式:分析最近N根K线(例如,最近12根月线)
- 日期时间模式:从特定市场事件或日期开始
- 锁定机制:在历史点冻结分析,同时价格继续变化
- 多时间框架:在当前图表上绘制任意时间框架的回归线
- 智能偏差方法
-
- 平均:使用均值偏差的平衡水平(适合交易区间)
- 独立:适应方向性波动的不对称通道
- 最大:显示极端价格边界以进行全范围分析
- 专业工具
-
- 6个斐波那契回撤水平(11.4%、23.6%、38.2%、61.8%、78.6%、88.6%)
- 6种价格类型:开盘价、高价、低价、收盘价、中位价、典型价
- 仅历史模式:排除形成中的K线以实现稳定回测
- 无限延伸选项,用于长期预测
- 完全的颜色自定义
它的独特之处
与基本回归工具不同,此指标赋予您控制权。锁定您的分析以研究特定事件后价格的表现。在对称和非对称通道之间切换。结合更高时间框架的结构与更低时间框架的执行——所有这些都基于为可靠性构建的简洁高效代码。
清晰的图表。明确的结构。自信的决策。
摘要
指标配置
客户评价
0.0
评价:0
客户评价
该产品尚无评价。已经试过了?抢先告诉其他人!
讨论
常见问答
Fibonacci
cTrader Store 提供的所有产品,包括交易机器人、指标和插件,均由第三方开发者提供,仅供信息参考和技术访问之用。cTrader Store 并非经纪商,不提供投资建议、个人推荐或任何未来业绩保证。


价格
注册日期 20/12/2024
8.28K
免费安装