
Описание
https://chartshots.spotware.com/c/695bec6c74055
https://chartshots.spotware.com/c/695bed35bf7b7
https://chartshots.spotware.com/c/695bed6b139df
https://chartshots.spotware.com/c/695bed8ea6bdb
📊 PIVOT BREAKER BLOCK
🤔
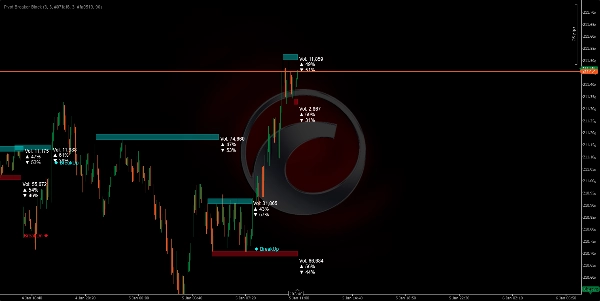
Pivot Breaker Block — это визуальный индикатор, который автоматически определяет ключевые точки разворота цены (локальные максимумы и минимумы) и строит "ценовые блоки" вокруг этих критических уровней. Когда цена снова приближается к этим похожим уровням, алгоритм рисует прямоугольники (зоны), представляющие уровни сопротивления (Supply) и поддержки (Demand).
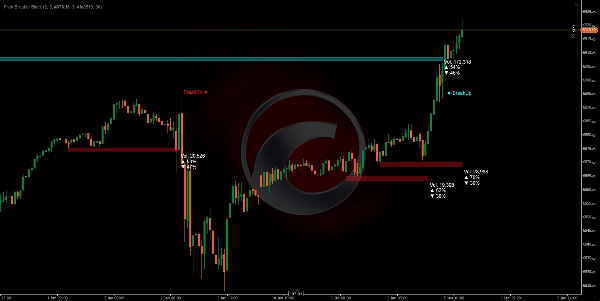
Система постоянно отслеживает, если цена пробивает эти зоны, генерируя четкие визуальные сигналы: BreakUp (бычий пробой) 🔼 или BreakDn (медвежий пробой) 🔽.
ДЛЯ ЧЕГО ЭТО НУЖНО? 🎯
1. Определение зон контроля рынка 🗺️
Алгоритм обнаруживает, где цена демонстрировала сильное сопротивление (потолок продаж) или поддержку (пол покупок). Когда эти уровни появляются несколько раз, рынок подтверждает их важность.
2. Визуализация накопления и распределения объема ⚖️
Каждый блок показывает:
- Общий объем обработанный в этой зоне
- % покупок (бычьи свечи) 📈
- % продаж (медвежьи свечи) 📉
Это позволяет видеть, покупает ли рынок или продает внутри этой области, раскрывая намерения рынка.
3. Предвидеть точки пробоя 🚨
Когда цена приближается к этим зонам, у вас есть наивысшая вероятность значительного движения. Алгоритм автоматически обнаруживает, когда цена их пробивает, оповещая вас в реальном времени.
КАК РАБОТАЕТ ЛОГИКА ⚙️
Фаза 1: Обнаружение пивотов (точек разворота) 🔍
Алгоритм ищет максимумы и минимумы, которые соответствуют определенному критерию:
- Пивот максимум: Свеча, у которой максимум выше максимумов 5 предыдущих и 5 последующих свечей.
- Пивот минимум: Свеча, у которой минимум ниже минимумов 5 предыдущих и 5 последующих свечей.
Этот параметр "5" (Pivot Lookback) является настраиваемым в зависимости от волатильности, которую вы хотите захватить.
Фаза 2: Распознавание зоны контроля 🎯
После определения пивота система сравнивает его с предыдущим пивотом того же типа. Если разница между ними меньше 20% от ATR (текущая мера волатильности), это означает, что рынок повторно посещает ранее отвергнутый похожий уровень.
Фаза 3: Размер зоны 📏
Высота каждого блока рассчитывается динамически с использованием ATR (Average True Range):
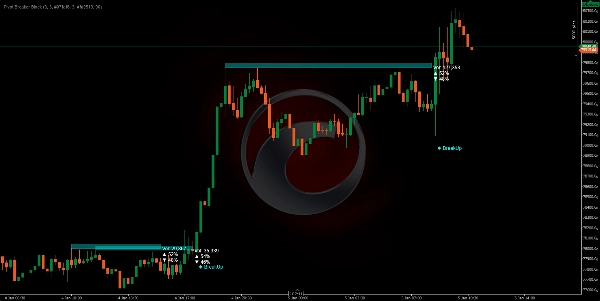
- Supply (красный): Потолок находится на ATR × 0.5 пунктов выше пивота.
- Demand (голубой): Пол находится на ATR × 0.5 пунктов ниже пивота.
Это означает, что зоны автоматически адаптируются к волатильности актива. На волатильных рынках зоны шире; на спокойных — уже.
Фаза 4: Анализ объема в реальном времени 💹
Пока цена находится внутри зоны, алгоритм суммирует все объемы покупок и продаж с момента начала блока:
- Покупка: Все свечи, у которых закрытие выше открытия (бычий объем).
- Продажа: Все свечи, у которых закрытие ниже открытия (медвежий объем).
Эти проценты показывают вам доминирующее намерение внутри этой зоны.
Фаза 5: Обнаружение пробоя 🚀
Алгоритм отслеживает каждую новую свечу:
- BreakUp (↑): Закрытие пересекает выше потолка Supply → сигнал бычьего пробоя.
- BreakDn (↓): Закрытие опускается ниже пола Demand → сигнал медвежьего пробоя.
Когда это происходит, блок деактивируется и появляется текстовый сигнал на экране.
КАК ИСПОЛЬЗОВАТЬ 🛠️
Установка и настройка ⚙️
- Добавьте индикатор на вашу платформу cTrader.
- Доступ к настраиваемым параметрам:
ПараметрЗначениеРекомендация
Pivot Lookback
Сколько свечей слева/справа оценивается для подтверждения пивота
5 (стандарт), увеличивайте на старших таймфреймах
Supply Zone Factor
Высота красного блока (сопротивление)
5.0 (стандарт), настройте по желанию
Demand Zone Factor
Высота голубого блока (поддержка)
5.0 (стандарт), настройте по желанию
Прозрачность
Прозрачность блока (0=невидимый, 255=сплошной)
90 (рекомендуется для видимости)
Цвета
Настройте визуальное оформление
Красный для Supply, голубой для Demand
Торговая стратегия 💡
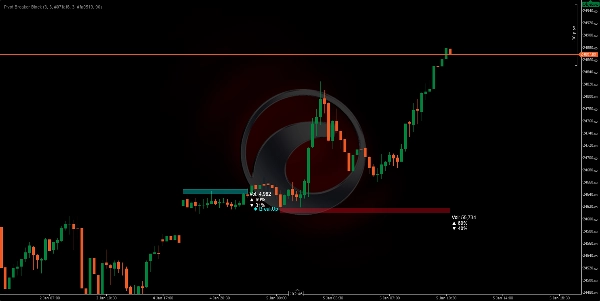
Сценарий 1: Вход в лонг (покупка) 📈
- Ждите, пока цена сформирует Demand блок (голубой) с % покупок > 55%.
- При появлении BreakUpподтвердите ваш бычий вход.
- Стоп-лосс (SL) ниже пола блока.
Сценарий 2: Вход в шорт (продажа) 📉
- Ищите Supply блок (красный) с % продаж > 55%.
- При BreakDnоткройте медвежью позицию.
- Стоп-лосс (SL) выше потолка блока.
Сценарий 3: Разворот (Среднее возвращение) 🔄
- Если цена находится внутри Demand блока, но % покупок низок (< 45%)...
- Ожидайте, что цена отскочит вверх не достигнув BreakUp.
- Входите в покупку около пола с тейк-профитом (TP) у потолка.
Оптимальные таймфреймы ⏰
- H4/D1: Более значимые блоки, движения длительной продолжительности.
- H1: Хороший баланс между шумом и возможностями.
- M15: Быстрый вход, требует подтверждения объемом.
Сводка
The indicator continuously monitors price action relative to these zones, providing real-time breakout signals: "BreakUp" for bullish breakouts above resistance and "BreakDn" for bearish breakouts below support. Each block displays cumulative volume data, including total volume processed and the percentage of buying (bullish) versus selling (bearish) activity, helping traders assess market intention within these areas.
Pivot Breaker Block supports multiple trading strategies, including breakout entries and mean reversion, with configurable parameters such as pivot lookback period, zone height factors, and visual transparency. It is suitable for various markets including Forex, indices, commodities, stocks, and cryptocurrencies, and works effectively on timeframes from 15 minutes to daily charts.
Key features:
- Automatic pivot detection with adjustable lookback
- Dynamic supply and demand zone sizing based on ATR
- Real-time volume accumulation and buy/sell ratio visualization
- Breakout alerts with on-screen signals
- Supports multiple asset classes and timeframes for versatile use


![Логотип продукта "[Hamster-Coder] Pivot Points MTF"](https://cdn.ctrader.com/image/webp/4c143e5a-309c-40e3-a578-f04d1e133ffa_31159)


