

说明
MyZtrade MTF ATR 区域 — 多时间框架基于 ATR 的支撑与阻力区域
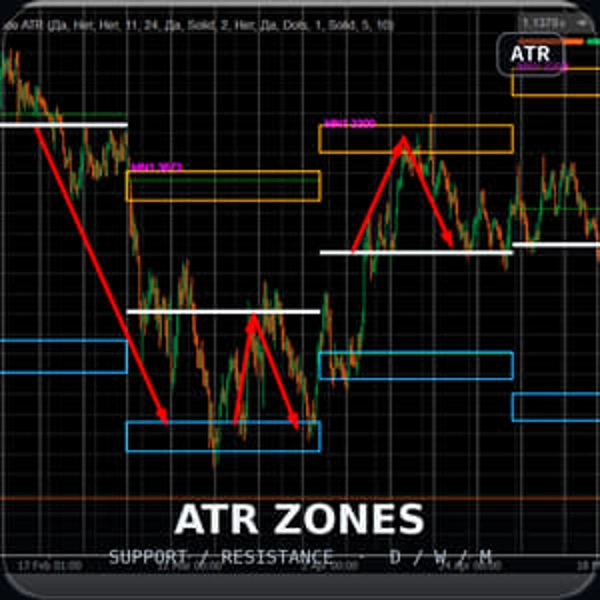
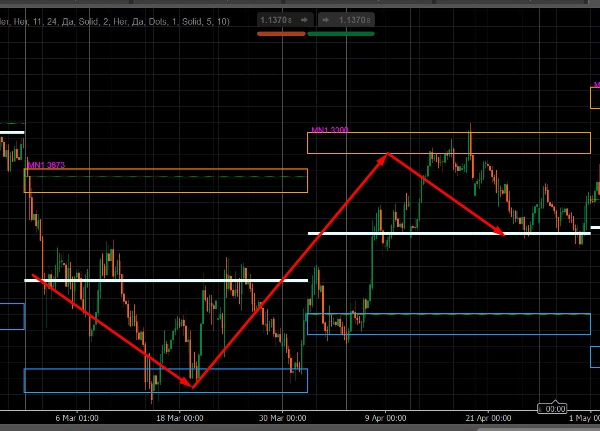
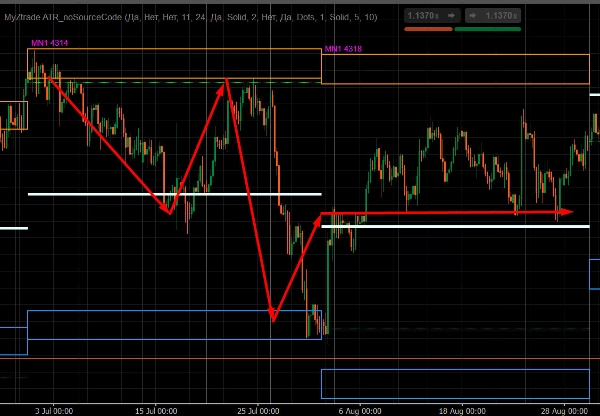
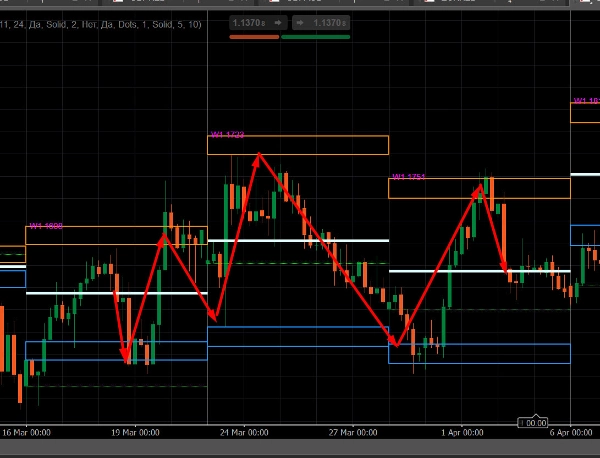
该指标基于较高时间框架的平均高低价区间(每月、每周和每日)绘制潜在的反转区域(支撑/阻力),与图表自身的时间框架无关。
功能介绍
对于每个启用的时间框架(月度 / 周度 / 日度),该指标:
• 计算该时间框架内指定数量最近柱子的平均区间(高-低)(默认:11根柱子)
• 在图表上绘制矩形阻力和支撑区域,区域位置相对于每根柱子的高点/低点偏移该平均区间值
• 用波动值(点数)和时间框架前缀标注每个区域(例如,MN1 2696,W1 1180,D1 340)— 当同时启用多个时间框架时非常有用
• 另外绘制柱子的开盘价线和区域内的中线
• 单独跟踪当前(尚未收盘)柱子 — 其区域会随着柱子的发展实时移动
主要特点
• 多时间框架同时启用 — 月度、周度和日度可以相互独立启用
• 不受图表时间框架限制 — 例如,可以在小时图上查看月度区域
• 外观完全可定制 — 颜色、线条粗细和样式、区域填充/轮廓、文字大小
• 作为视觉指引;不生成交易信号且不包含进出场逻辑
摘要
AI summary
MyZtrade W1 MN zones is a multi-timeframe indicator that identifies potential reversal zones of support and resistance on trading charts. It calculates the average range (High–Low) over a configurable number of recent bars (default 11) for selected higher timeframes—Monthly, Weekly, and Daily—regardless of the chart’s current timeframe. The indicator then plots rectangular zones offset from each bar’s high and low by this average range, visually marking areas where price reversals may occur.
Each zone is labeled with its volatility value in points and the corresponding timeframe prefix (e.g., MN1, W1, D1) to distinguish multiple enabled timeframes. Additional visual elements include the bar’s opening price line and a median line within each zone. The indicator also tracks the current, developing bar in real time, updating its zone dynamically.
Key features include simultaneous display of multiple timeframes, full customization of visual appearance (colors, line styles, text size), and independence from the chart’s timeframe, allowing monthly zones to be viewed on intraday charts. This tool serves as a visual guide for support and resistance levels based on volatility but does not provide trading signals or entry/exit logic.
Each zone is labeled with its volatility value in points and the corresponding timeframe prefix (e.g., MN1, W1, D1) to distinguish multiple enabled timeframes. Additional visual elements include the bar’s opening price line and a median line within each zone. The indicator also tracks the current, developing bar in real time, updating its zone dynamically.
Key features include simultaneous display of multiple timeframes, full customization of visual appearance (colors, line styles, text size), and independence from the chart’s timeframe, allowing monthly zones to be viewed on intraday charts. This tool serves as a visual guide for support and resistance levels based on volatility but does not provide trading signals or entry/exit logic.
指标配置
客户评价
0.0
评价:0
客户评价
该产品尚无评价。已经试过了?抢先告诉其他人!
讨论
常见问答
EMA
Supertrend
Supply & Demand
ATR
Moving Average
VWAP
Support & Resistance
cTrader Store 提供的所有产品,包括交易机器人、指标和插件,均由第三方开发者提供,仅供信息参考和技术访问之用。cTrader Store 并非经纪商,不提供投资建议、个人推荐或任何未来业绩保证。
该作者的其他作品







!["[Stellar Strategies] VBO" 标识](https://cdn.ctrader.com/image/webp/f034c012-94d4-445a-a01b-febd1cdedaef_36944)













价格

注册日期 28/06/2025