present
注册即可在首次购物时获得 $50 优惠
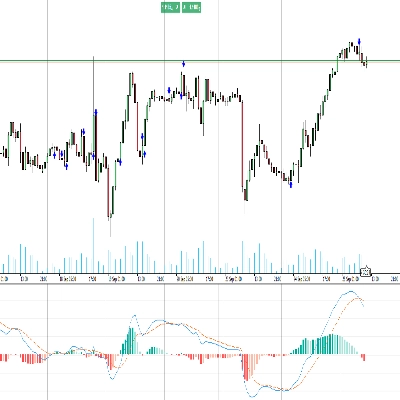
Trading product for Pivot Levels 指标 Fibonacci Fair Value Gap, image 1
Pivot Levels
指标
版本 1.1, Nov 2026
Windows 版、Mac 版
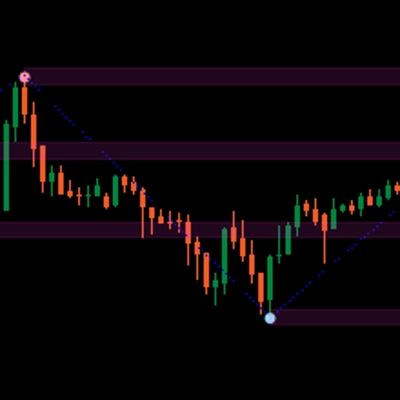
Trading product for Pivot Levels 指标 Fibonacci Fair Value Gap, image 2
1
免费安装

说明

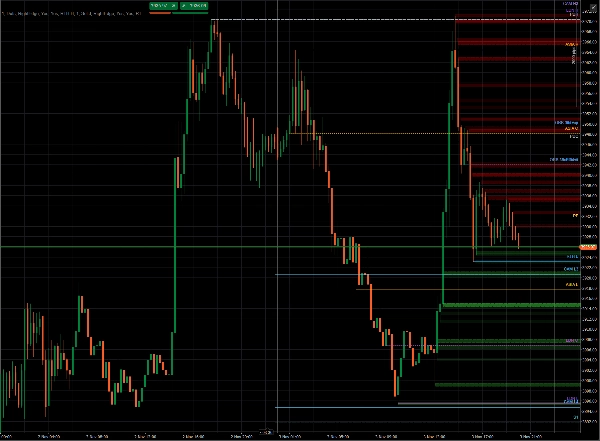
枢轴点水平:交易时段、前一日和前一周、ORB、地板枢轴和卡玛里拉

枢轴点水平将在您的图表上绘制交易者每天关注的价格水平,以清晰的射线和标签显示,并添加一个紧凑的表格,显示每个交易时段的区间。这是一个仅显示的研究工具:它不会下单,也不会更改您的账户任何内容。

它绘制的内容

  • 今日交易时段:RTH时段(纽约时间09:30–16:00)、亚洲时段(东京)和伦敦时段的开盘价、最高价和最低价。交易时段时间遵循各自的时区,因此夏令时会自动处理,您无需输入任何时间。
  • 昨日:前一个交易日的开盘价、最高价、最低价和收盘价
  • 前一周:前一周的开盘价、最高价、最低价和收盘价。
  • 开盘区间突破(ORB):RTH时段前15分钟和30分钟内达到的最高点(“向上”)和最低点(“向下”)。仅在区间形成后绘制,或在区间形成时实时绘制。
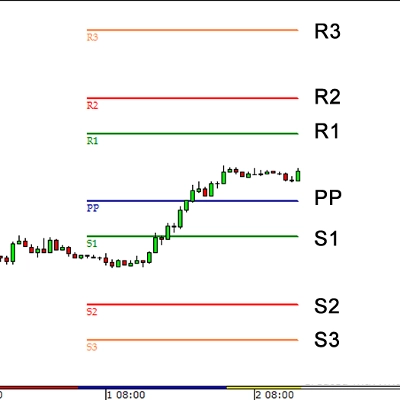
  • 地板枢轴:PP、R1、R2、S1、S2,基于前一个交易日计算
  • 卡玛里拉:H3、H4、H5、L3、L4、L5,基于前一个交易日计算

每条线从其形成的时间点开始(最高点、最低点或开盘价的时间),因此您可以看到水平设定的时间。当前水平向右延伸为射线。过去的日期可以选择显示以供复查。


交易时段区间监控

一个小表格显示当前交易日每个时段的点数和点差区间,以及表示时段方向的箭头。当前时段会被高亮显示。您可以选择角落、偏移量和字体大小。


无设置的交易日

默认情况下,交易日取自您经纪商的每日K线,因此换仓和夏令时均为您的服务器实际时间,无需配置。

或者,您可以使用固定的纽约时间17:00作为交易日,适用于所有经纪商。您还可以选择基于完整时段或仅RTH时段计算昨日、周度和枢轴水平。


自定义

  • 每个水平都有独立的开关、标签、线宽、线型、颜色(使用原生颜色选择器)、标签位置和可选的价格值
  • 标签位置:左侧、右侧(跟随最后一根K线),或锚定在图表的右侧或左侧边缘,靠近Y轴,即使滚动或缩放也保持不变
  • 一个通用开关,用于仅显示标签,或显示标签和数值,以及标签字体大小
  • 历史数据在后台加载,确保图表响应流畅。数据时间框架自动从您的图表选择,也可以更改


值得了解

  • 适用于您的CFD经纪商数据支持的任何品种和图表时间框架,因为所有水平均仅基于价格计算
  • 水平值基于经纪商提供的数据,因此不同经纪商之间的数值可能略有差异
  • 这是一个分析工具,不是交易建议。历史水平不保证未来价格行为


摘要

指标配置
指标分类
支撑与阻力
输出类型
可视化
数据要求
仅 K 线
支持的信号
突破
反转
趋势强度
波动性
触及水平位
突破水平位
时段开盘区间
背离
交叉

讨论

客户评价

0.0
评价:0
客户评价
该产品尚无评价。已经试过了?抢先告诉其他人!

常见问答

Fibonacci
Fair Value Gap
Key Levels
Order Block
Market Structure
Supply & Demand
Support & Resistance
cTrader Store 提供的所有产品,包括交易机器人、指标和插件,均由第三方开发者提供,仅供信息参考和技术访问之用。cTrader Store 并非经纪商,不提供投资建议、个人推荐或任何未来业绩保证。

该作者的其他作品

指标
Fibonacci
Key Levels
+5
Displays the swing level zones shared by Flex Renko Inverse on any timeframe chart. Requires Flex Renko Inverse
指标
Pin Bar
Order Block
+5
NEVER MISS A TREND & LET TRENDS RUN with Sierra Chart's Flex Renko Inverse, rebuilt for cTrader.

猜您喜欢

指标
VWAP
Volume
+4
Volume Profile + VWAP with Standard Deviations
"RSI Advanced" 标识
评分最高
5.0
(4)
$20
/
$30
指标
AI
ATR
+12
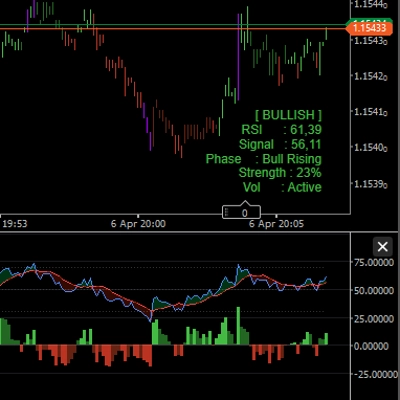
The standard Relative Strength Index (RSI), RSI & Signal Cloud, Smart Volatility Filter (ATR), On-Chart Info Dashboard
指标
Supertrend
Moving Average
Easy Trade: Trend & Breakout Indicator for cTrader
指标
Key Levels
Market Structure
+1
See the day's percentage targets from the open, so you know where the session stands at a glance.
指标
Volume
Key Levels
+5
Volume Profile Pro v2 - A Lightweight and Highly Customizable Side & Range Volume Profile
指标
Prop
Forex
+4
Pivot Points Standard — All-in-One Multi-Timeframe Pivot Indicator for cTrader
指标
Grid
Prop
+14
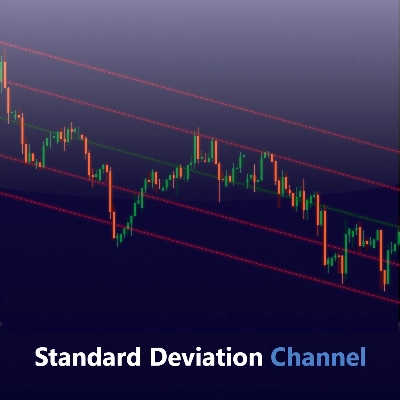
Visualize trends with Standard Deviation Channel! Display median, and add customizable upper/lower deviation channels.
指标
Volume
Key Levels
+1
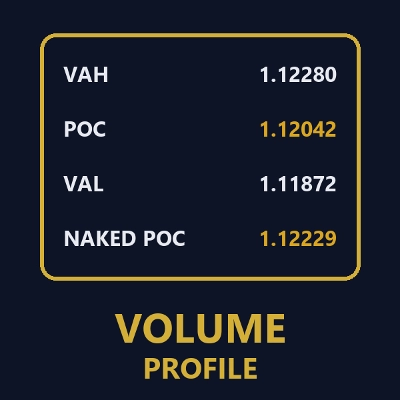
Session volume profiles from tick volume: POC, value area high and low, and naked POCs extended until touched.
指标
Supply & Demand
Support & Resistance
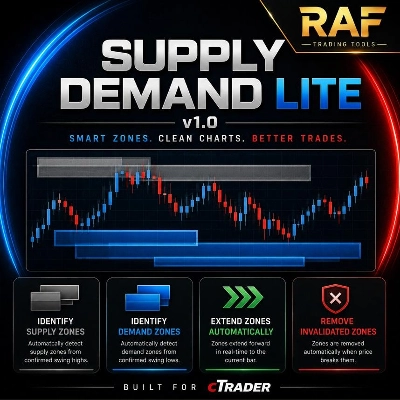
RAF Supply Demand Lite v1.0 automatically detects clean Supply and Demand zones using confirmed swing highs and lows. Zo
指标
BOS
Volume
+5
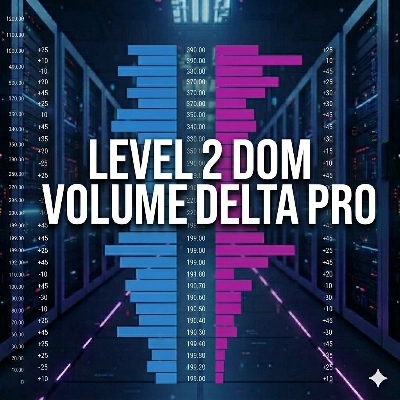
The Volume Delta Indicator using Institutional Level 2 DOM Data, The Edge Institutions Pay Millions For, now on cTrader
指标
MACD
Prop
+14
Customize the MACD! Choose colors, get real-time tick updates, and see crossover points for enhanced trading precision.
"wt.Z-Trend" 标识
评分最高
4.5
(4)
$19
指标
Forex
Crypto
+5
This indicator combines two independent analytical engines into a single overlay on your chart.
指标
Volume
Support & Resistance
Compare up to 27 symbols across eight timeframes with seven analysis engines and an interactive cTrader dashboard.
指标
Auto Fibonacci Retracement Indicator for cTrader
指标
ATR
RSI
+17
Turn data into precision trades with AlphaTrend Pro Max — advanced trend, signal & structure analysis in one.
指标
Prop
Forex
+4
Automatic Support/Resistance zones from swing points.
指标
ATR
MSS
+5
Advanced market structure and institutional cycle mapper with visual reference cards and entry alerts
指标
ATR
SMC
+19
Smart Liquidity Sweep detector with auto-drawing True Channels and real market structure mapping.

价格

1
免费安装