الوصف
انعكاس 3-شمعات
📊 ما هو؟
الانعكاس 3-شمعات هو مؤشر تقني يحدد أنماط انعكاس محددة تتكون من ثلاث شمعات متتالية بالضبط. يشير هذا النمط الكلاسيكي إلى تغييرات محتملة في اتجاه السعر من خلال هيكل بصري واضح: شمعة الاتجاه، شمعة الإرهاق، وشمعة الانعكاس.
🎯 ما الغرض منه؟
يساعد هذا المؤشر المتداولين على:
- اكتشاف الانعكاسات الصعودية والهبوطية باستخدام هيكل 3 شمعات
- تصفية الإشارات الخاطئة من خلال تأكيد الاتجاه القابل للتكوين
- تحديد مناطق الدعم والمقاومة بناءً على الأنماط المؤكدة
- تصوير فرص التداول باستخدام علامات بيانية بديهية
- التداول على الانعكاسات ذات الاحتمالية العالية على أي إطار زمني
🔍 كيف يعمل؟
النمط الصعودي (انعكاس 3-شمعات صعودي)
هيكل ثلاثي الشمعات:
- شمعة 1 (هبوطية): الإغلاق أدنى الافتتاح - يؤكد ضغط البيع
- شمعة 2 (هبوطية إرهاق): تحقق أدنى مستويات جديدة وأعلى مستويات جديدة أدنى شمعة 1، مع إغلاق هبوطي - إشارة استسلام ⚠️
- شمعة 3 (انعكاس صعودي): الإغلاق فوق الافتتاح وأعلى من أعلى شمعة 1 - يؤكد تحول السيطرة ✅
النمط الهبوطي (انعكاس 3-شمعات هبوطي)
هيكل معاكس:
- شمعة 1 (صعودية): الإغلاق فوق الافتتاح - يؤكد ضغط الشراء
- شمعة 2 (امتداد صعودي): تحقق أعلى مستويات جديدة وأدنى مستويات جديدة فوق شمعة 1، مع إغلاق صعودي - إشارة تمدد مفرط ⚠️
- شمعة 3 (انعكاس هبوطي): الإغلاق أدنى الافتتاح وأدنى من أدنى شمعة 1 - يؤكد تحول السيطرة ✅
نظام الإدارة البصرية (آلة الحالة)
يعالج المؤشر كل نمط في ثلاث مراحل متتالية:
المرحلة 1 - اكتشاف النمط: 🔍
- يتم تحديد هيكل الشمعات الثلاثة الكامل
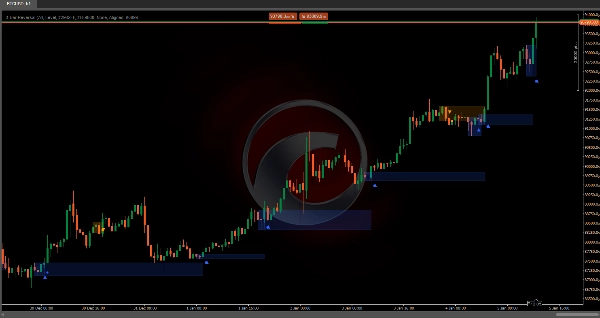
- يظهر مؤشر مثلث (▲ صعودي / ▼ هبوطي) على الشمعة الثالثة
- يرسم مستطيل إعداد شفاف جزئياً يغطي:
-
- صعودي: من أعلى شمعة 1 إلى أدنى أدنى (شمعة 2 أو 3)
- هبوطي: من أدنى شمعة 1 إلى أعلى أعلى (شمعة 2 أو 3)
- يشير هذا المستطيل إلى "منطقة المعركة" حيث حدث الانعكاس
المرحلة 2 - التأكيد أو الإبطال: ⏳
ينتظر النظام الشمعة التالية بعد النمط للتحقق منه:
تأكيد صعودي: ✅
- يجب أن يتجاوز إغلاق الشمعة التالية أعلى شمعة 1 (سقف المستطيل)
- يظهر نقطة صلبة (●) تشير إلى التأكيد
- يصبح المستطيل منطقة دعم نشطة
تأكيد هبوطي: ✅
- يجب أن يكسر إغلاق الشمعة التالية أدنى شمعة 1 (أرضية المستطيل)
- يظهر نقطة صلبة (●) تشير إلى التأكيد
- يصبح المستطيل منطقة مقاومة نشطة
الإبطال: ❌
- يفشل الصعودي إذا: الإغلاق أدنى الحد الأدنى للمستطيل أو يظهر نمط هبوطي
- يفشل الهبوطي إذا: الإغلاق أعلى الحد الأقصى للمستطيل أو يظهر نمط صعودي
- يتوقف المستطيل عن التمدد (يموت النمط)
تمديد الانتظار: ⏸️
- إذا لم يكن هناك تأكيد أو فشل، يمتد المستطيل أفقياً شمعة تلو الأخرى
المرحلة 3 - منطقة دعم/مقاومة نشطة: 🎯
- بمجرد التأكيد، تمتد المنطقة إلى اليمين إلى أجل غير مسمى
- المنطقة الصعودية: تظل نشطة طالما السعر فوق الأرضية
- المنطقة الهبوطية: تظل نشطة طالما السعر تحت السقف
- تتعطل المنطقة عندما يكسر السعرها تمامًا في الاتجاه المعاكس
⚙️ الإعدادات الرئيسية
وضع النمط
يتحكم في أنواع الأنماط المقبولة:
- عادي: يقبل فقط عندما تغلق الشمعة 3 داخل نطاق الشمعة 1
-
- صعودي: الإغلاق أقل من أعلى شمعة 1 (انعكاس معتدل)
- هبوطي: الإغلاق أعلى من أدنى شمعة 1 (انعكاس معتدل)
- محسن: يقبل فقط عندما تغلق الشمعة 3 خارج نطاق الشمعة 1 🔥
-
- صعودي: الإغلاق أعلى من أعلى شمعة 1 (انعكاس انفجاري)
- هبوطي: الإغلاق أقل من أدنى شمعة 1 (انعكاس انفجاري)
- الكل (موصى به): يقبل كلا النوعين بدون تمييز ⭐
نوع الدعم/المقاومة
- مستوى: وظيفة خط أساسية (محدودة في هذا الإصدار)
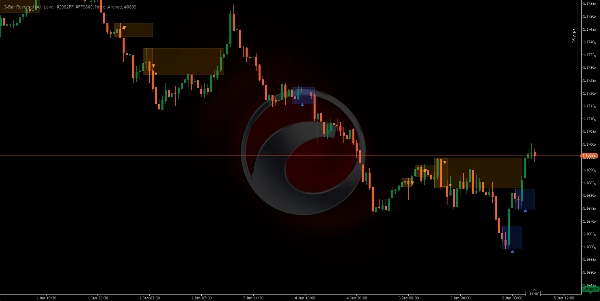
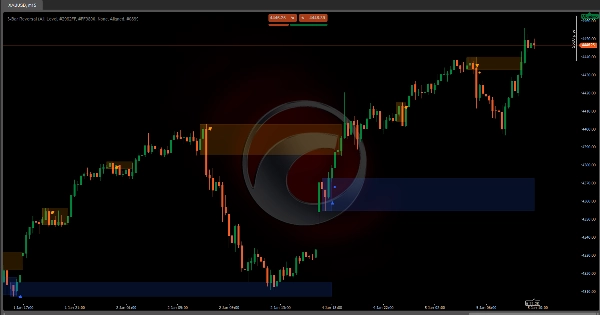
- منطقة: يرسم مستطيلات مظللة تحدد مناطق الدعم والمقاومة بعد التأكيد 📦
- لا شيء: لا توجد مناطق دعم/مقاومة، يعرض فقط الأنماط المكتشفة
ألوان قابلة للتخصيص 🎨
- لون الانعكاس الصعودي: للمثلثات والمستطيلات والمناطق الصعودية (الافتراضي:
#2962FF- أزرق) - لون الانعكاس الهبوطي: للمثلثات والمستطيلات والمناطق الهبوطية (الافتراضي:
#FF9800- برتقالي) - لون الاتجاه الصعودي: لتصور فلتر الاتجاه (الافتراضي:
#089981- أخضر) - لون الاتجاه الهبوطي: لتصور فلتر الاتجاه (الافتراضي:
#F23645- أحمر)
🔧 فلاتر الاتجاه
يمكن للمؤشر تصفية الأنماط بناءً على اتجاه الاتجاه العام باستخدام أربع طرق:
1. سحابة المتوسط المتحرك ☁️
يستخدم متوسطين متحركين لتحديد الاتجاه:
المعلمات:
- نوع المتوسط المتحرك: بسيط، أسي، هول، موزون، إلخ. (الافتراضي: هول)
- الفترة السريعة: 50 (الافتراضي)
- الفترة البطيئة: 200 (الافتراضي)
منطق الفلترة (متوافق):
- يتم اكتشاف الاتجاه الصعودي عندما: السعر > المتوسط السريع و المتوسط السريع > المتوسط البطيء ✅
- يتم اكتشاف الاتجاه الهبوطي عندما: السعر < المتوسط السريع و المتوسط السريع < المتوسط البطيء ✅
- يعرض فقط الأنماط الصعودية في الاتجاه الصعودي والأنماط الهبوطية في الاتجاه الهبوطي
منطق معاكس (معاكس):
- يعكس الشروط لالتقاط الانعكاسات الكبرى ضد الاتجاه
2. سوبرتريند 📈
مؤشر تتبع الاتجاه بناءً على التقلبات (ATR):
المعلمات:
- فترة ATR: 10 (الافتراضي) - نافذة حساب التقلبات
- عامل المضاعف: 3.0 (الافتراضي) - حساسية المؤشر
المنطق:
- يحسب النطاق العلوي والسفلي باستخدام ATR
- السعر فوق سوبرتريند = اتجاه صعودي 🟢
- السعر تحت سوبرتريند = اتجاه هبوطي 🔴
- يفلتر الأنماط وفقًا للمواءمة المكونة
3. قنوات دونشيان 📊
يستخدم أقصى وأدنى الأسعار خلال فترة:
المعلمات:
- طول القناة: 13 (الافتراضي)
المنطق:
- القناة العليا = أعلى قمة خلال N فترة
- القناة السفلى = أدنى قاع خلال N فترة
- النقطة الوسطى = (العليا + السفلى) / 2
- السعر فوق النقطة الوسطى = اتجاه صعودي 🟢
- السعر تحت النقطة الوسطى = اتجاه هبوطي 🔴
4. لا شيء (بدون فلتر) 🔓
يعرض جميع أنماط 3-شمعات المكتشفة دون النظر إلى الاتجاه العام. مفيد لـ:
- الأسواق المتقلبة ضمن نطاق
- تحليل النمط النقي
- تداول الانعكاس في أي سياق
مواءمة الاتجاه
تطبق عندما يكون الفلتر نشطًا:
- متوافق: يعرض فقط الأنماط التي تتماشى مع الاتجاه المحدد ➡️
-
- الأنماط الصعودية فقط في الاتجاه الصعودي
- الأنماط الهبوطية فقط في الاتجاه الهبوطي
- معاكس: يعرض فقط الأنماط التي تعاكس الاتجاه المحدد 🔄
-
- الأنماط الصعودية في الاتجاه الهبوطي (انعكاس كبير)
- الأنماط الهبوطية في الاتجاه الصعودي (انعكاس كبير)
الملخص
It operates in three phases: pattern detection, confirmation or invalidation based on the next candle's behavior, and establishing active support or resistance zones that extend while price respects them. The indicator supports configurable pattern modes (Normal, Enhanced, or All) to control acceptance criteria for reversals.
Trend filtering is available through four methods—Moving Average Cloud, Supertrend, Donchian Channels, or no filter—allowing users to align pattern signals with overall market trends or capture counter-trend reversals. Confirmed reversal zones are displayed as shaded rectangles or levels, customizable in color for bullish and bearish signals, trend filters, and zones.
This tool is designed for use on any timeframe and across various markets, including forex pairs (EURUSD, GBPUSD, USDJPY, NZDUSD), commodities (XAUUSD), indices (NAS100), and cryptocurrencies (BTCUSD). It aids traders in detecting high-probability reversals, filtering false signals, and identifying support and resistance zones with clear visual markers.