present
Daftar dan dapatkan diskon $50 untuk pembelian pertama Anda
Trading product for RSI reversal MTF Indikator Aggressive RSI, image 1
RSI reversal MTF
Indikator
Versi 1.0, May 2026
Windows, Mac
Trading product for RSI reversal MTF Indikator Aggressive RSI, image 2
Trading product for RSI reversal MTF Indikator Aggressive RSI, image 3
Trading product for RSI reversal MTF Indikator Aggressive RSI, image 4
Trading product for RSI reversal MTF Indikator Aggressive RSI, image 5
86
Penjualan
1.19K
Instal gratis

Deskripsi

RSI Reversal Radar MTF Signals

This indicator allows scalpers to select up to 4 different MTF timeframes, including the 1-minute timeframe.
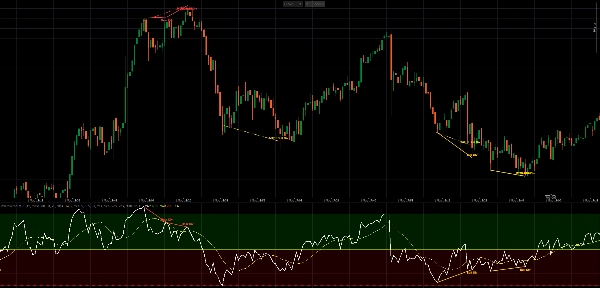
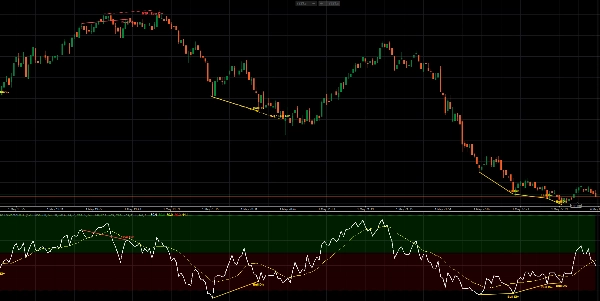
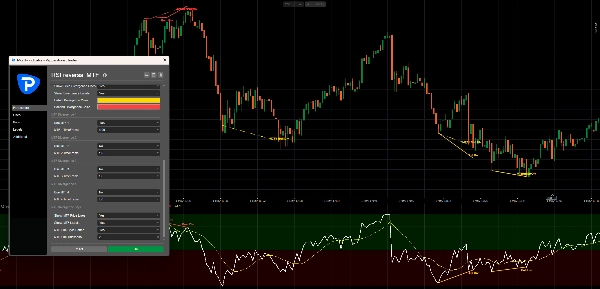
The selected MTF bullish or bearish divergence lines are drawn extra on the main price chart, giving scalpers additional potential reversal signals on top of the normal divergence from the current chart timeframe.

The RSI subwindow always stays based on your current chart timeframe.


Description

RSI Reversal Radar MTF Signals is an RSI-based cTrader indicator designed especially for traders who want to spot potential reversal signals across multiple timeframes.

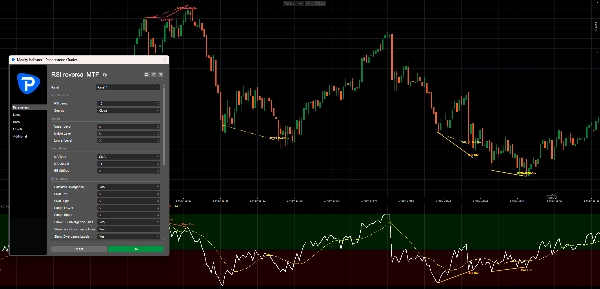
It includes a classic RSI panel with upper, middle, and lower levels, optional RSI smoothing, Bollinger Bands, cloud zones, and automatic bullish and bearish divergence detection.

The main feature is the multi-timeframe divergence system. You can enable up to 4 separate MTF slots, each with its own timeframe, such as:

1 Minute
5 Minute
15 Minute
1 Hour

These selected MTF bullish and bearish divergence signals are drawn directly on the main price chart as extra reversal lines. This makes the indicator useful for scalpers who want to see lower-timeframe and higher-timeframe reversal pressure together on one chart.


How It Works

The indicator first calculates the RSI on your current chart timeframe.

For example, if you are trading on a 1-minute chart, the RSI subwindow remains based on the 1-minute chart data. The normal divergence system detects current-timeframe bullish and bearish divergence and draws those signals in the RSI window and on the main chart.

The divergence logic is:

Bullish divergence:
Price makes a lower low,
while RSI makes a higher low.

Bearish divergence:
Price makes a higher high,
while RSI makes a lower high.

When MTF divergence is enabled, RSI Reversal Radar MTF Signals also checks your selected additional timeframes separately. Each selected timeframe calculates its own RSI and detects its own bullish or bearish divergence.

Those MTF signals are then drawn only on the main price chart as extra bullish or bearish reversal lines.

This means the RSI subwindow does not change when you select MTF timeframes. It stays clean and based on your current chart, while the main chart receives extra reversal signals from the selected timeframes.


Example Scalping Setup

A scalper could use:

Chart timeframe: 1 Minute

MTF 1: 1 Minute
MTF 2: 5 Minute
MTF 3: 15 Minute
MTF 4: 1 Hour

The main chart can then show:

Current chart divergence
+ extra 1-minute MTF divergence
+ extra 5-minute MTF divergence
+ extra 15-minute MTF divergence
+ extra 1-hour MTF divergence

This helps scalpers see when fast 1-minute reversal signals align with stronger signals from higher timeframes.


Key Features

  • Built for scalpers and multi-timeframe traders
  • Supports up to 4 selectable MTF divergence timeframes
  • Includes 1-minute MTF support for fast scalping signals
  • MTF bullish and bearish divergence lines are added extra on the main chart
  • RSI subwindow stays based on the current chart timeframe
  • RSI levels: 80, 50, and 20
  • Green and red RSI cloud zones
  • Optional RSI smoothing MA
  • Supports SMA, EMA, SMMA/RMA, WMA, VWMA
  • Optional SMA Bollinger Bands on RSI
  • Automatic regular bullish divergence
  • Automatic regular bearish divergence
  • Normal divergence lines in the RSI subwindow
  • Normal divergence lines on the main price chart
  • Optional dotted or solid MTF line style
  • Customizable MTF line thickness
  • Optional labels for normal and MTF divergence signals


Practical Use

Bullish divergence can suggest that selling pressure may be weakening and that price could be preparing for an upward reversal.

Bearish divergence can suggest that buying pressure may be weakening and that price could be preparing for a downward reversal.

For scalpers, the most interesting areas are often where fast signals and higher-timeframe signals appear close together. For example, a 1-minute bullish divergence near a 5-minute or 15-minute bullish divergence may highlight a stronger potential reversal zone.

These signals are not meant to be used alone. They are best combined with market structure, support and resistance, trendlines, volume, or your own entry confirmation.
Ringkasan

Profil indikator
Kategori indikator
Momentum
Tipe output
Sinyal
Filter
Visualisasi
Persyaratan data
Hanya batang
Volume
Data eksternal
Sinyal yang didukung
Divergen
Breakout
Reversal
Kekuatan tren

Diskusi

Ulasan pelanggan

0.0
Ulasan: 0
Ulasan pelanggan
Belum ada ulasan untuk produk ini. Sudah mencobanya? Jadilah pemberi ulasan pertama!

Pertanyaan umum

Aggressive
RSI
Produk-produk yang tersedia melalui cTrader Store, termasuk bot trading, indikator, dan plugin, disediakan oleh pengembang pihak ketiga serta hanya ditujukan untuk akses teknis dan informasi. cTrader Store bukan broker dan tidak menyediakan saran investasi, rekomendasi pribadi, atau jaminan apa pun tentang kinerja di masa mendatang.

Produk lain dari penulis ini

Indikator
AI
ATR
+27
SR Commander is a clean and intelligent support and resistance indicator for cTrader, built to help traders identify key
Indikator
AI
ATR
+20
Buy and Sell Signals
Indikator
AI
ATR
+27
WICK COMMANDER — Know Exactly When the Market Commits
Indikator
AI
ATR
+27
Overbought Oversold Indicator
Indikator
AI
ATR
+20
Know Sure Thing (KST) momentum engine
Indikator
AI
SMC
+5
Coloring trendline/ Colored Trendline / Color Trendline
Indikator
AI
ATR
+27
VWAP Sniper Elite -- Institutional Trend Engine
Indikator
AI
SMC
+13
Dynamic Liquidity Depth exposes hidden volume
Indikator
AI
ATR
+26
Entry Momentum MACD Power Guide
Indikator
AI
ATR
+27
The Professional “All-in-One” Trading Suite (buy and sell indicator)
Indikator
AI
ATR
+26
SR Commander — Multi Timeframe Edition. See where the big money draws the line. Trade on your timeframe. Think on theirs
Logo "crossover 1"
Peringkat teratas
4.2
(5)
$19
/
$29
Indikator
AI
Grid
+10
Crossover Buy and Sell Alerts and signals

Anda mungkin juga suka

Indikator
MACD
Key Levels
+2
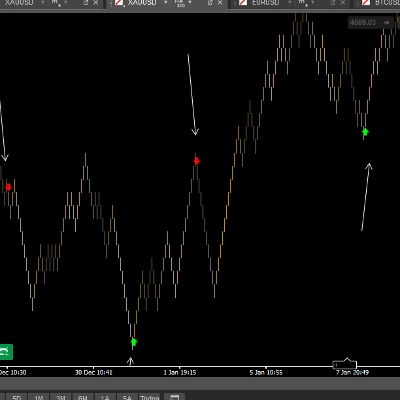
Trend indicator with multi-timeframe filters, generating signals only on fully completed bricks & candles. No Repaint.
Indikator
AI
ATR
+26
MacD Custom Indicator-Multiple Time Frame
Indikator
Volume
Channel
+2
Identify key support and resistance levels through detailed volume distribution analysis.
Indikator
Auto-detect supply & demand zones, remove broken levels, and trade smarter with real-time alerts. Precision made simple.
Indikator
AI
Prop
+14
Professional Trading Indicator Transform Your Trading with Intelligent Signal Detection RenkoProfit
Indikator
Key Levels
Liquidity Grab
+2
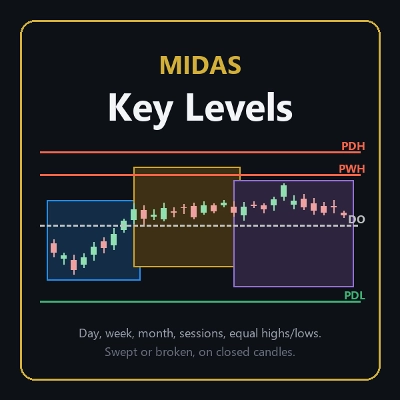
The levels you mark each morning, drawn and followed: PDH/PDL, weekly, monthly, sessions, equal highs/lows.
Indikator
Volume
Support & Resistance
Compare up to 27 symbols across eight timeframes with seven analysis engines and an interactive cTrader dashboard.
Indikator
ATR
SMC
+18
Precision SMC tool with HTF sweeps, MSS confirmation & smart FVG detection for high-probability reversals.
Indikator
Signal
Fractal Arrow Buy and Sell Indicator
Indikator
Forex
Crypto
+5
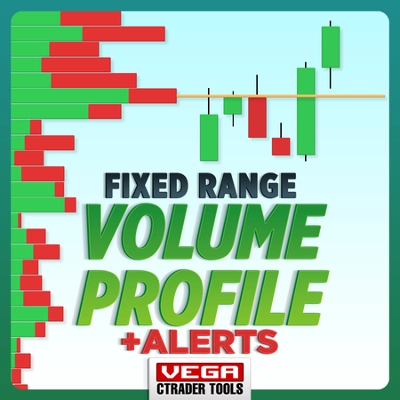
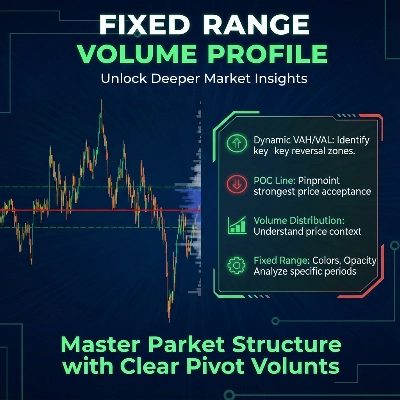
Fixed Range Volume Profile (FRVP) : analyzes price volume within a custom rectangle to find POC, VAH, and VAL.
Indikator
ATR
Prop
+14
Optimize exits with Chandelier Exit! Visualize stop-loss points dynamically for improved trading precision and safety.
Indikator
ATR
EMA
+4
Range-filter BUY/SELL signals scored by four confluence layers, with a stop, five targets and a trend panel
Indikator
ATR
Forex
+2
Trade fearlessly: auto-adjusts order blocks, manages risks, and ensures precision. Was Free for early users now -80%
Indikator
The Advanced Volume Profile Indicator calculates POC, Median, and Mode, revealing key price levels for smarter trading.
Indikator
Spot Strong Trends Early & Filter Market Noise
Indikator
Imbalance
Key Levels
+1
Keep open imbalance zones, untouched session highs and lows and the day's ADR range in view, without scrolling back.
Indikator
ATR
Volume
+3
Volume profile key levels - POC, value area, volume peaks and troughs - with break, rejection and retest signals
Indikator
XAUUSD
Professional Volume Profile Indicator - Shows volume distribution, POC, Value Areas & Buy/Sell pressure.

Harga

86
Penjualan
1.19K
Instal gratis