present
Registe-se e receba 50 $ de desconto na sua primeira compra
Trading product for CVD_Per-Bar Delta Indicador Volume, image 1
CVD_Per-Bar Delta
Indicador
Versão 1.0, May 2026
Windows, Mac
Trading product for CVD_Per-Bar Delta Indicador Volume, image 2
Trading product for CVD_Per-Bar Delta Indicador Volume, image 3
Trading product for CVD_Per-Bar Delta Indicador Volume, image 4
Trading product for CVD_Per-Bar Delta Indicador Volume, image 5
Trading product for CVD_Per-Bar Delta Indicador Volume, image 6
Trading product for CVD_Per-Bar Delta Indicador Volume, image 7
Desde 23/04/2026

Descrição

A candle shows you the outcome. It doesn't show you who did the work.

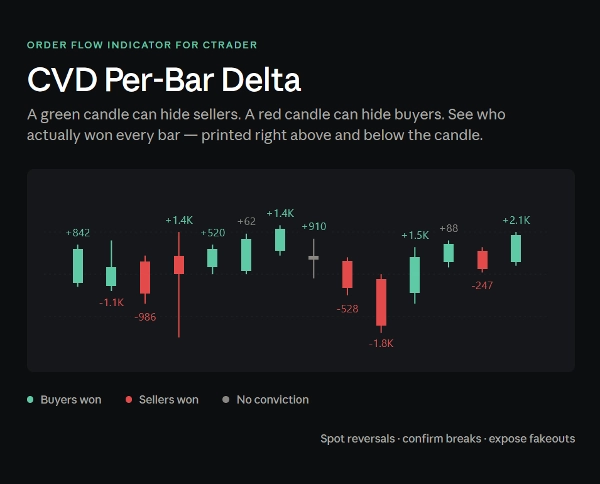
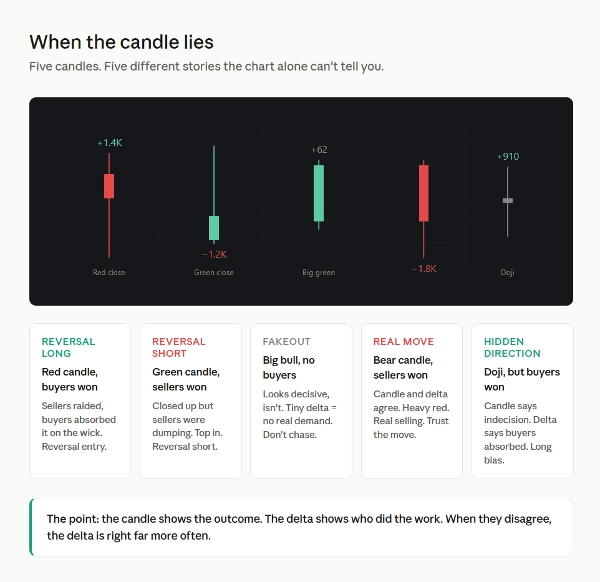
A bullish candle can close green while sellers were dumping into the rally. A bearish candle can close red while buyers absorbed every seller in the bar. A doji can hide a +900 delta of one-sided pressure. Price action alone can't tell you. Volume alone can't tell you. You need to know who won.

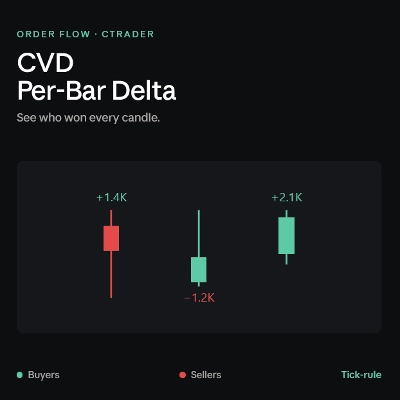
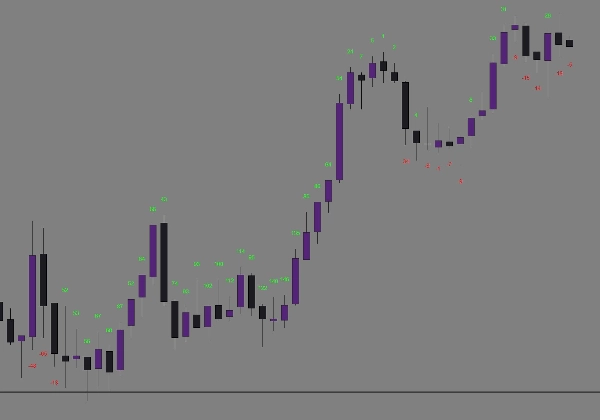
CVD Per-Bar Delta uses tick-rule classification on real cTrader tick data to count buyers vs sellers inside every candle, then prints the result directly on your chart as a colour-coded number. One glance and you know whether bulls or bears were in control — and by how much.

What you see:

  • A green number above buyer-dominated bars
  • A red number below seller-dominated bars
  • Number size scales with conviction — small numbers mean a fair fight, big numbers mean one side dominated

Where it earns its place:

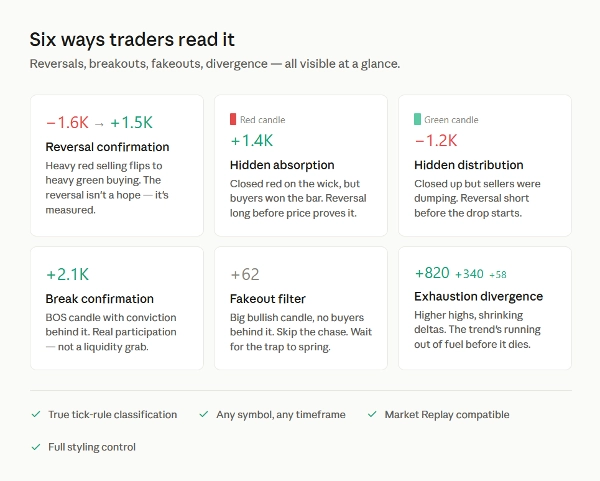
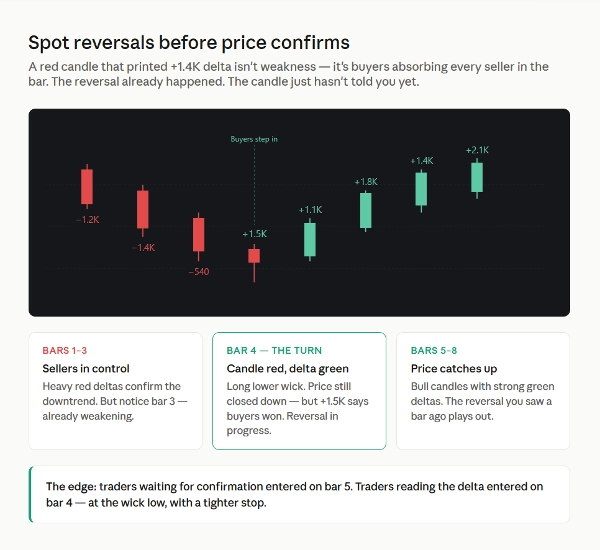
Reversal confirmation. A red candle that printed +1.4K delta isn't weakness — it's buyers absorbing every seller in the bar. The reversal already happened. The candle just hasn't told you yet. Enter at the wick low with a tight stop, while everyone else waits for the next candle to confirm.

Hidden absorption (long setups). Price spikes down into your support zone or order block. Long lower wick. Big green number. Buyers swallowed the raid. That's a high-probability reversal long — and the delta saw it before the candle closed.

Hidden distribution (short setups). Price grinds higher into resistance. Each green candle prints smaller delta than the last, then a green candle closes with a red delta. Buyers exhausted, sellers dumping into the rally. Top in. Short.

Break confirmation. A BOS candle with a strong delta in the break direction is real participation. Same break with a weak or opposite-coloured delta is a liquidity grab dressed as a breakout. Filter the fakeouts before you take them.

Exhaustion divergence. Price keeps making higher highs but the green deltas are getting smaller with each push. Buyers are running out of ammunition. The trend is dying before it dies.

Conviction filter. Two candles look identical on the chart. One has +850 delta. The other has +40. They are not the same candle. Skip the noise. Take the conviction bars.

Built for serious traders:

  • True tick-rule classification using cTrader's tick data — not synthetic OHLC approximation
  • Works on any symbol, any timeframe, any chart
  • Compatible with Market Replay for back-testing your read
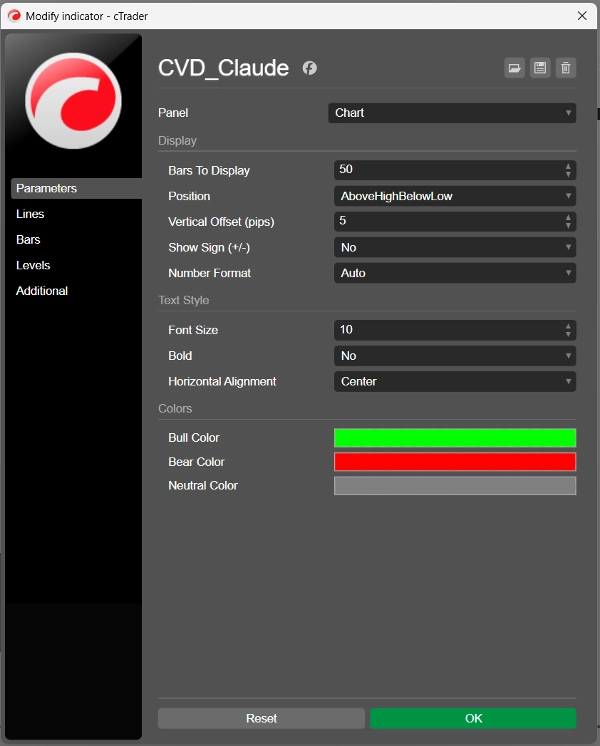
  • Last 50 bars by default, fully configurable — zero clutter

Full styling control:

  • Position — above bar, below bar, or smart (above highs for bull bars, below lows for bear bars)
  • Text — font size 6 to 30, optional bold, alignment options
  • Colours — bull, bear and neutral pickers, match any chart theme
  • Format — raw numbers, K-thousands, or auto-switching
  • Display — adjustable pip offset, sign toggle, bar count

Important: This indicator requires tick data. Live charts use it automatically. For Market Replay, select "Tick data" when starting your replay session.

Pairs especially well with: order block / SMC strategies, reversal trading at key levels, breakout systems, mean-reversion setups, and any methodology that benefits from confirming intent behind a candle.

The chart shows you what happened. The delta shows you why.
Resumo

Perfil do indicador
Categoria do indicador
Volume
Tipo de resultado
Visualização
Requisitos de dados
Dados de tick
Sinais suportados
Divergência

Conversa

Avaliações de clientes

0.0
Avaliações: 0
Avaliações de clientes
Ainda não há avaliações para este produto. Já o experimentou? Seja o primeiro a contar a outras pessoas!

Perguntas frequentes

Volume
Os produtos disponíveis através da cTrader Store, incluindo bots de negociação, indicadores e plugins, são fornecidos por programadores terceiros e são disponibilizados apenas para fins informativos e de acesso técnico. A cTrader Store não é um corretor e não fornece aconselhamento em matéria de investimento, recomendações pessoais ou qualquer garantia de desempenho no futuro.

Também poderá gostar de

Indicador
AI
ATR
+10
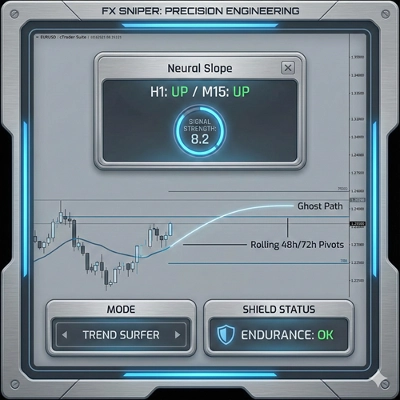
FX Sniper: Multi-pair Forex analysis tool. Features trend logic, adaptive pivots, and momentum filtering for major pairs
Indicador
Volume
Key Levels
View tick activity across a selected chart range with Point of Control, Value Area High and Value Area Low.
Indicador
Fisher Transform with smoothing. Spot reversals and cycles with precision. Great for any market, any timeframe.
Indicador
Prop
Forex
+4
Displays real-time balance, equity, P&L, margin metrics directly on your charts.
Indicador
BOS
EMA
+5
VWAP Bands indicator with 3 standard deviation levels, buy/sell zones, and a draggable ON/OFF button to toggle the entir
Indicador
AI
ATR
+20
“Dynamic Swing VWAP — Structure-Anchored, Volatility-Adaptive, Market-Ready.” 🚀
Indicador
This indicator is a valuable tool for traders looking to identify significant opening price level of any asset.
Indicador
Volume
Support & Resistance
Compare up to 27 symbols across eight timeframes with seven analysis engines and an interactive cTrader dashboard.
Indicador
Forex
Crypto
+3
Consecutive Series Moves — Reveal the True Pulse of Price Action
Indicador
Forex
Indices
+1
Professional Fair Value Gaps with multitimeframe spot on
Indicador
BB Breakout Oscillator with alerts! Spot trend reversals using Bollinger Bands. Bullish/Bearish crossovers Alerts.
Indicador
Market Sessions
Indicador
Key Levels
Liquidity Grab
+2
The levels you mark each morning, drawn and followed: PDH/PDL, weekly, monthly, sessions, equal highs/lows.
Indicador
AI
ATR
+27
Supertrend Indicator
Indicador
Key Levels
Trend-filtered signals, transparent trade plans and a multi-timeframe decision panel for cTrader.
Indicador
Prop
Forex
+7
The Parabolic SAR, or "Stop and Reverse," is a dynamic technical analysis tool.
Logótipo de "Dem"
Bem avaliado
4.2
(4)
$20
Indicador
Forex
BTCUSD
+5
Scalping indicator for Renko 100 using EMAs to show trend and entry zones with clear colored rectangles.
Indicador
RSI
MACD
Unlock market insights with our Multi-Timeframe Market Levels indicator, enhancing your trading strategies effortlessly

Preço

Desde 23/04/2026