present
Registrieren Sie sich und erhalten Sie $50 Rabatt auf Ihren ersten Kauf
Trading product for Helix Volume Profile Indikator Key Levels Volume, image 1
Helix Volume Profile
Indikator
Version 1.0, Sep 2026
Windows, Mac
4.0
Bewertungen: 1
Trading product for Helix Volume Profile Indikator Key Levels Volume, image 2
Trading product for Helix Volume Profile Indikator Key Levels Volume, image 3
Trading product for Helix Volume Profile Indikator Key Levels Volume, image 4
Trading product for Helix Volume Profile Indikator Key Levels Volume, image 5
Trading product for Helix Volume Profile Indikator Key Levels Volume, image 6
Trading product for Helix Volume Profile Indikator Key Levels Volume, image 7
Trading product for Helix Volume Profile Indikator Key Levels Volume, image 8
Trading product for Helix Volume Profile Indikator Key Levels Volume, image 9
Trading product for Helix Volume Profile Indikator Key Levels Volume, image 10
Trading product for Helix Volume Profile Indikator Key Levels Volume, image 11
15
Verkäufe
302
Kostenlose Installationen

Beschreibung

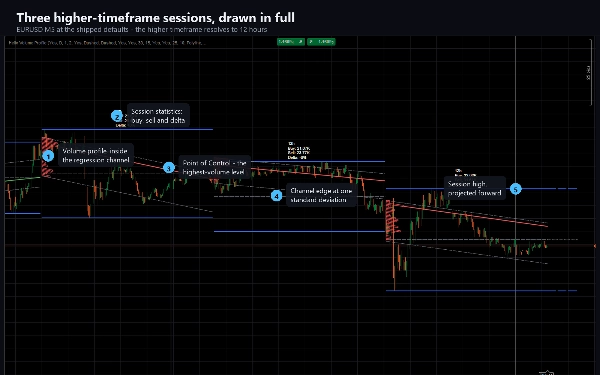
Helix Volume Profile erstellt ein vollständiges Bild der höherstufigen Sitzung, in der sich das aktuelle Chart befindet.

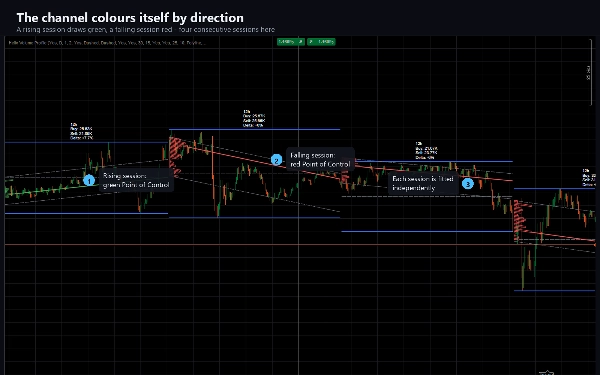
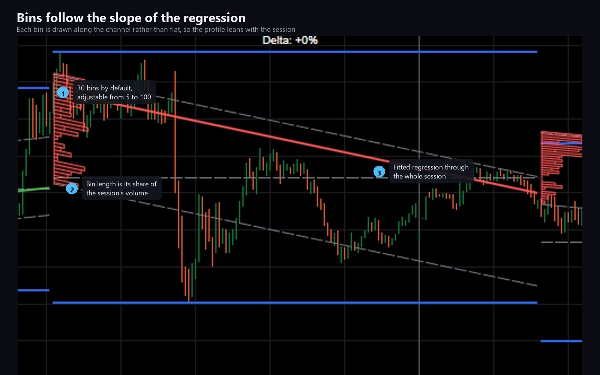
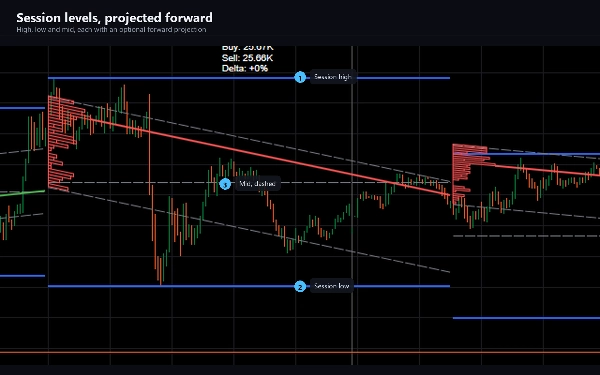
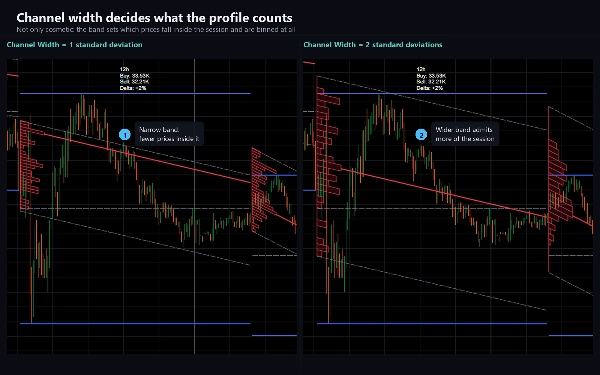
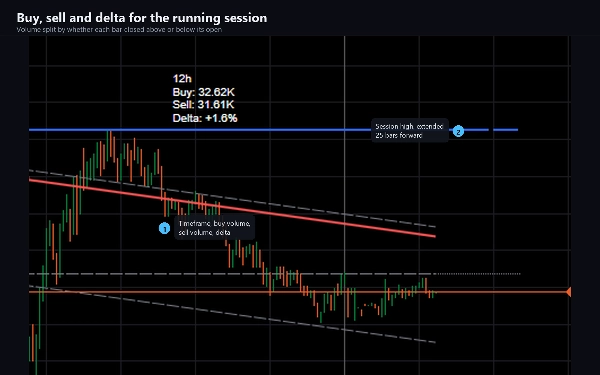
Für jede Sitzung passt es eine logarithmische Regression über jeden bisher vorhandenen Balken an, zeichnet einen Kanal mit einer konfigurierbaren Anzahl von Standardabweichungen Breite darum und füllt diesen Kanal mit einem Volumenprofil, dessen Bins der Steigung der Regression folgen, anstatt flach zu liegen. Das Bin mit dem höchsten Volumen wird mit einer Point of Control-Linie markiert, die in der Farbe der Richtung des Kanals dargestellt wird. Die Hoch-, Tief- und Mittelwerte der Sitzung werden daneben gezeichnet und können nach vorne projiziert werden, und ein kompaktes Label zeigt das Kaufvolumen, Verkaufsvolumen und die Differenz zwischen beiden an.

Der höhere Zeitrahmen wird standardmäßig für Sie ausgewählt und passt sich dem Chart an: eine 12-Stunden-Sitzung auf M5, vier Stunden auf M1, zwei Tage auf M15, eine Woche auf H1, ein Monat auf H4. Sie können dies deaktivieren und die Sitzung selbst einstellen – Minuten, Tage, Wochen oder Monate werden alle akzeptiert.

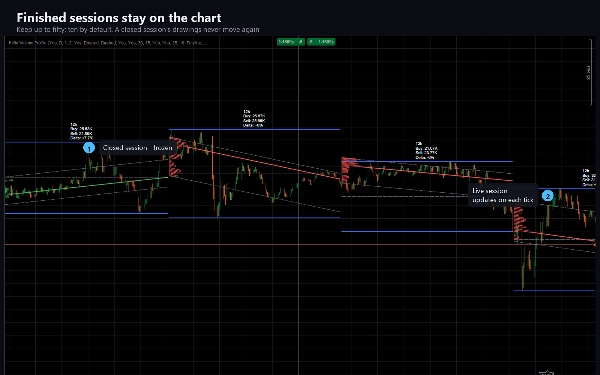
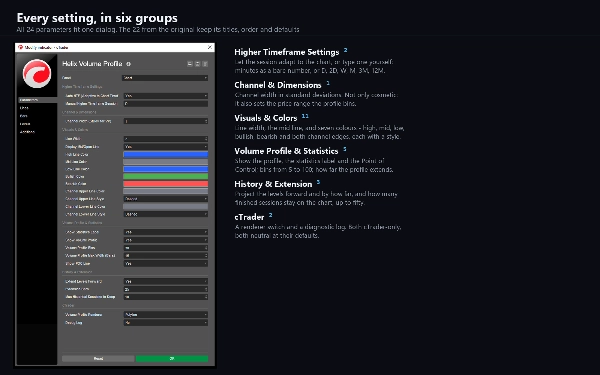
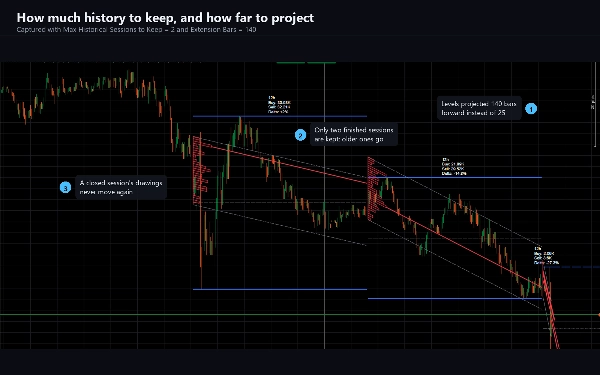
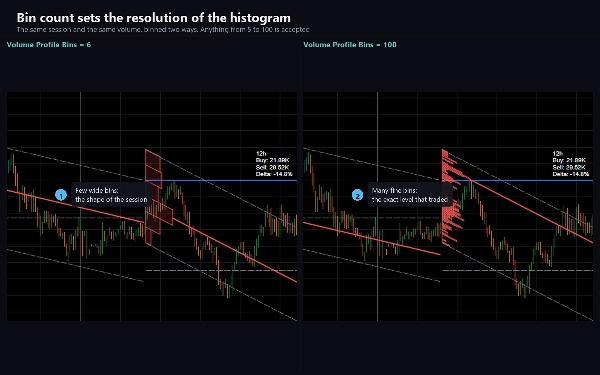
Alles ist anpassbar. Kanalbreite, die Anzahl der Profilbins von 5 bis 100, wie weit das Profil reicht, ob die Point of Control, das Statistiklabel und die Vorwärtsprojektionen angezeigt werden, die Linienbreiten und -stile, sieben Farben und wie viele abgeschlossene Sitzungen auf dem Chart verbleiben, bis zu fünfzig.

WOFÜR ES DA IST

Ablesen, wo sich der Preis innerhalb seiner höherstufigen Struktur befindet, ohne den Arbeitszeitrahmen zu verlassen. Der Kanal zeigt die Drift und Streuung der Sitzung; das Profil zeigt, wo das Volumen tatsächlich innerhalb davon akkumuliert wurde; die Point of Control markiert das Niveau mit der meisten Aktivität. Trader nutzen diese, um Unterstützung und Widerstand zu definieren, zu beurteilen, ob eine Bewegung im Verhältnis zur Sitzung überdehnt ist, und um zu sehen, ob Kauf- oder Verkaufsdruck dominierte.

Geeignet für jedes Instrument und jeden Zeitrahmen. Am informativsten auf Intraday-Charts von M1 bis H4, wo die adaptive Sitzung ein sinnvolles Fenster bietet; bei Daily und höher sollte die Sitzung manuell eingestellt werden.

WIE ES SICH VERHÄLT

Die Live-Sitzung aktualisiert sich bei jedem Tick und ihre Zeichnungen bewegen sich, bis die Sitzung schließt – der Kanal wird neu angepasst, das Profil neu aufgebaut und die Niveaus neu gemessen, sobald jeder Balken eintrifft. Sobald eine Sitzung endet, werden ihre Zeichnungen eingefroren und ändern sich nie wieder. Dies ist absichtlich so und entspricht der Funktionsweise der Methode; wenn Sie Niveaus benötigen, die sich intrabar nie bewegen, lesen Sie eine geschlossene Sitzung und nicht die Live-Sitzung.

Das Volumen bei einem Forex-Symbol ist die Tick-Anzahl, die Ihr Broker meldet, sodass das Profil Ihren eigenen Feed widerspiegelt.

TECHNISCH

Indikator, Overlay. 24 Parameter. Keine Handelsberechtigungen, kein Dateizugriff und kein Netzwerkzugriff – es ist mit AccessRights auf None gesetzt und kann keine Order platzieren. Beinhaltet eine Testversion, die auf EURUSD beschränkt ist, ohne Zeitlimit und ohne deaktivierte Funktionen.

Die Dokumentation umfasst Installation, jeden Parameter mit seiner Funktion und eine Fehlerbehebung, die jedes Verhalten erklärt, das Nutzer überrascht.

Handel beinhaltet Risiken. Vergangene Leistungen garantieren keine zukünftigen Ergebnisse.

Zusammenfassung

KI-Zusammenfassung
Helix Volume Profile is a technical indicator overlay designed to analyze higher-timeframe sessions within the current chart timeframe. It fits a logarithmic regression channel to the session's price bars, adjustable by standard deviations, and overlays a volume profile aligned with the channel's slope. The indicator highlights the Point of Control—the price level with the highest traded volume—colored according to the channel's direction. It also displays session high, low, and midpoint levels, which can be projected forward, alongside a label showing buy volume, sell volume, and their delta.

The higher timeframe session adapts automatically based on the chart timeframe (e.g., 12 hours on M5, one week on H1) but can be manually set to minutes, days, weeks, or months. Users can customize channel width, number of volume bins (5 to 100), profile extension, visibility of elements, colors, line styles, and how many past sessions remain visible (up to 50).

The live session updates on every tick, recalculating the channel and volume profile until session close, after which the data is fixed. Volume data reflects the broker's tick count for forex symbols. Helix Volume Profile is suitable for any instrument and timeframe, with particular utility on intraday charts from M1 to H4. It includes 24 adjustable parameters and operates without trading permissions or network access.
Indikatorprofil
Indikatorkategorie
Trend
Ausgabetyp
Visualisierung
Datenanforderungen
Volumen

Diskussion

Kundenbewertungen

4.0
Bewertungen: 1
5
0 %
4
100 %
3
0 %
2
0 %
1
0 %
Kundenbewertungen
September 18, 2026
Helix Volume Profile combines a sloped regression channel with a direction-aware volume profile, session H/L/Mid levels and forward projections. The profile rendered cleanly on EURUSD and XAUUSD across M1/H1. The main caveat is that the enabled buy/sell/delta statistics label was not visible.

Häufig gestellte Fragen (FAQ)

Key Levels
Volume
Market Structure
Channel
Support & Resistance
Über den cTrader Store verfügbare Produkte, einschließlich Handelsbots, Indikatoren und Plugins, werden von externen Entwicklern bereitgestellt und nur zu Informations- und technischen Zugriffszwecken verfügbar gemacht. cTrader Store ist kein Broker und erbringt keine Anlageberatung, persönlichen Empfehlungen oder eine Garantie für zukünftige Performance.

Mehr von diesem Autor

Indikator
ATR
CCI
+4
A trend line that never steps back, a shaded band to the price, and a pointer at the swing where the trend turns.
cBot
Balanced
Fixed Lot
+5
Gold grid cBot for XAUUSD H1: four-signal confluence on closed bars, ladders closed at a basket profit, news filter
15.6%
Rendite
2.33
Gewinnfaktor
Indikator
ATR
EMA
+3
EMA cross filtered by a trend average and its ATR channel, with long, short and close marks and colored candles.
Indikator
ADX
ATR
+5
EMA-cross signals scored on six confluence layers, with an ATR stop, three targets and a live panel
Indikator
ATR
RSI
+5
Fusion trend line with a layered cloud, BULL and BEAR labels, scored re-entry triangles and exit markers.
Indikator
ATR
RSI
+4
Adaptive Ichimoku with nine-factor confluence scoring, five signal types, smart TP/SL and an MTF panel.
Indikator
ATR
RSI
+4
RSI bands drawn on price, confluence-scored BUY/SELL signals, an ATR stop with three targets
Indikator
ADX
ATR
+5
SuperTrend signals scored on five confluence factors, with an ATR stop, three targets and a dashboard.
Indikator
ADX
ATR
+5
Ten confluence layers scored on every closed bar, with an anti-chop gate, pivot levels and a live dashboard.
cBot
TP Manager
Break Even
+5
Gold cBot for prop-firm accounts: pick your firm, phase and size; risk is sized from the firm's rules, its limits kept
1.6
Gewinnfaktor
Indikator
ATR
EMA
+2
Eight-EMA ribbon with ATR trade zones, a nine-symbol screener and a five-timeframe trend dashboard.
Indikator
ATR
Volume
+3
Fibonacci trend signals on closed bars, with an ATR stop, up to four targets and a break-even ladder.

Das könnte Sie auch noch interessieren

Indikator
Forex
Real-Time Candlestick Pattern Detection with Custom Alerts & Trend Analysis for cTrader
Indikator
Master RSI reversals with Parabolic SAR precision! Get real-time alerts for high-probability trend changes.
Indikator
CandleColourFlow MultiFx - optimized to work on Fx Majors, Fx MInors, Fx Crosses
Indikator
AI
ATR
+27
Trade the Trend Flip. Control the Risk. 🎯📈”
„vwap“-Logo
Beliebt
4.8
(5)
$26
Indikator
VWAP
Forex
+2
Custom VWAP Indicator for cTrader
Indikator
ATR
RSI
+7
Identify bullish and bearish Order Blocks to spot key support/resistance levels and potential trend reversals! 📈🔄
Indikator
ATR
BTCUSD
+5
Trailing algo 📈 auto-tracks trends 🎯 adapts to volatility 🌟 precise moves 🛡️ retest signals 🚀 no lag, smart market
Indikator
Three ZigZag lines
Indikator
ATR
Wedge
+2
Strong Supertrend Turn Market Movement into a Clear Map Market analysis
Indikator
Smoothed CCI alerts! Audio & arrow signals for +/-100 crosses. Custom sounds & arrow filters. Precision trading!
Indikator
ATR
RSI
+14
A metric that can set 1 to 3 groups of Bollinger Bands
Indikator
ATR
Prop
+15
Initial Range – Where the open writes the script.
Indikator
ATR
EMA
+2
Eight-EMA ribbon with ATR trade zones, a nine-symbol screener and a five-timeframe trend dashboard.
Indikator
Imbalance
Fair Value Gap
+1
Multi-symbol, multi-timeframe Fair Value Gaps in one panel.
Indikator
Breakout
Allow trader to visualize Support & Resistance across different timeframes,give trader an overview of the current market
Indikator
Pin Bar
Inducement
+5
Institutional Nasdaq Session Liquidity Map with Live Point HUD, Sweep Alerts & Interactive Playbook.
Indikator
Supertrend
Moving Average
Easy Trade: Trend & Breakout Indicator for cTrader
Indikator
Doji
Wedge
+5
Angora Pattern Recognition is a cTrader indicator that finds, draws and tracks classic chart patterns automatically.

Preis

15
Verkäufe
302
Kostenlose Installationen