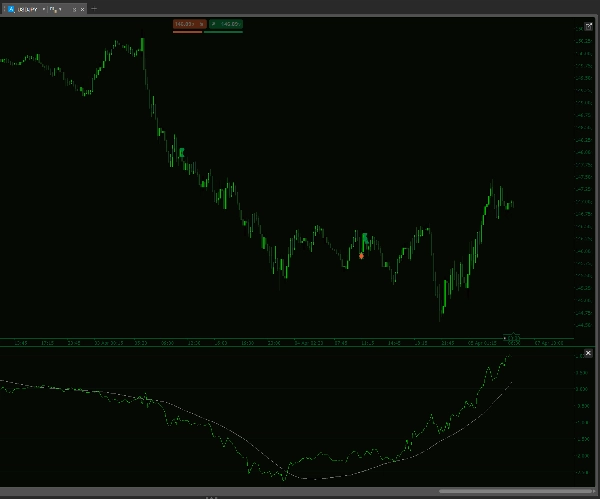
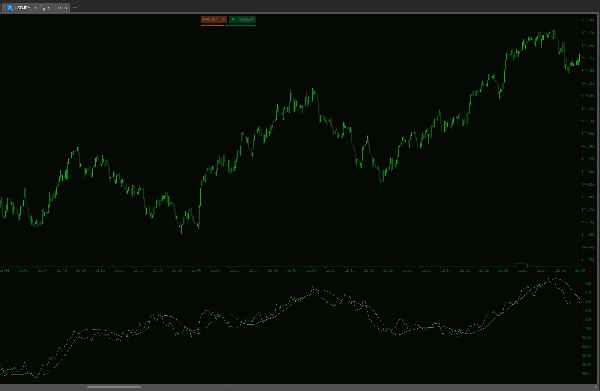
DXY w HMA
Indikator
119 downloads
Version 1.0, Apr 2025
Windows, Mac
In „DXY w HMA“ hochgeladenes BildIn „DXY w HMA“ hochgeladenes BildIn „DXY w HMA“ hochgeladenes BildIn „DXY w HMA“ hochgeladenes Bild
Seit 14/01/2025
41
Verkäufe
8.87K
Kostenlose Installationen

Elevate your trading strategy with the Historical DXY HMA Indicator—a cutting-edge cTrader tool engineered for precision and performance. This advanced indicator calculates a custom U.S. Dollar Index by combining the weighted percentage changes of six key currency pairs, providing you with a dynamic and reliable market gauge.

Key Features:

  • Custom DXY Calculation: Integrates six major USD pairs (EURUSD, USDJPY, GBPUSD, USDCAD, USDCHF, USDSEK) with configurable weights for a finely tuned index.
  • Dual Hull Moving Averages: Employs both short- and long-period Hull MAs to offer a clear picture of market trends and momentum.
  • Slope Smoothing: Enhances trend detection with a smoothed slope HMA, giving you an edge in identifying market reversals.
  • Robust Data Handling: Seamlessly syncs with your cTrader platform, ensuring accurate real-time analysis even when dealing with varying data sources.
  • Customizable Parameters: Fine-tune lookback counts and moving average periods to perfectly match your trading style and market conditions.

Designed with the modern trader in mind, the Historical DXY HMA Indicator simplifies complex market data into actionable insights, enabling you to make smarter, more confident trading decisions. Experience the next level of market analysis!


--------------------------

Please feel free to check out my other indicators!

https://ctrader.com/products/1181

https://ctrader.com/products/1182

https://ctrader.com/products/1180

https://ctrader.com/products/1015

https://ctrader.com/products/555

https://ctrader.com/products/553

https://ctrader.com/products/554

https://ctrader.com/products/552

https://ctrader.com/products/557

https://ctrader.com/products/845

https://ctrader.com/products/848

https://ctrader.com/products/847

https://ctrader.com/products/846

https://ctrader.com/products/551

https://ctrader.com/products/574

https://ctrader.com/products/573

https://ctrader.com/products/556

https://ctrader.com/products/558

https://ctrader.com/products/559

https://ctrader.com/products/560


0.0
Bewertungen: 0
Kundenbewertungen
Bisher gibt es keine Bewertungen für dieses Produkt. Haben Sie es schon ausprobiert? Dann können Sie die erste Person sein, die andere darüber informiert!
Indices
Forex
EURUSD
USDJPY

Mehr von diesem Autor

Indikator
Indices
Commodities
+3
Track major trading sessions (Tokyo, London, New York) with customizable colors and visual sessions on your chart.
Auto-detect supply & demand zones, remove broken levels, and trade smarter with real-time alerts. Precision made simple.
Market Session V2: Full Control. colors, history, session/text toggles, font size. Elevate your strategy!
Version 3: Full control of session display including start and end times of all 3 sessions!
Supply and demand zones. They're important. Here's a free version to get you started!
The Multi-Timeframe Candle Indicator displays candles from multiple timeframes in one window, enhancing market analysis!
Stay ahead with a real-time countdown to candle closes on all key timeframes: 5m, 15m, 30m, 1H, 4H, and Daily.
The Advanced Volume Profile Indicator calculates POC, Median, and Mode, revealing key price levels for smarter trading.
Indikator
Indices
Forex
+3
US Dollar Index
Indikator
NZDUSD
Forex
+2
RCS: 8 majors! AUD,USD,EUR,JPY,GBP,CAD,CHF,NZD. Find how strong each currency is relatively and trade smarter!

Das könnte Sie auch noch interessieren

Indikator
Indices
Commodities
+3
Technical self-analysis, WITH SOUND ALERT
Indikator
Stocks
Commodities
+4
Revolutionize Your Chart Analysis with Hybrid Candles & Precision Timing
Indikator
Indices
RSI
+7
The ZigZag indicator is a technical analysis tool primarily used to identify key price reversal points.
CandleColourFlow – smart color-coded trend indicator.
Indikator
Indices
Commodities
+3
Structural analysis framework designed to quantify swing point behavior at psychological price levels
Indikator
Grid
RSI
+20
Buy and Sell Signals
Indikator
NAS100
Indices
+3
Visualize market asymmetry like never before — steady climbs meet sudden drops with the Donchian PSAR
Indikator
Signal
MACD
+1
Version 1.2: Advanced Trend Detection & Visualization System
Indikator
Grid
NAS100
+20
Algorithmic trend precision for cTrader.
Indikator
RSI
Breakout
+12
🎁 21-Day Full Trial — All Features Unlocked. No limits, no credit card.
Indikator
RSI
Breakout
+1
🔍 Automatically detect support and resistance levels based on "swings" or pivots
Indikator
Signal
Channel Trading is a volatility-based indicator using envelope theory to spot price breakouts and trade signals.
Seit 14/01/2025
41
Verkäufe
8.87K
Kostenlose Installationen