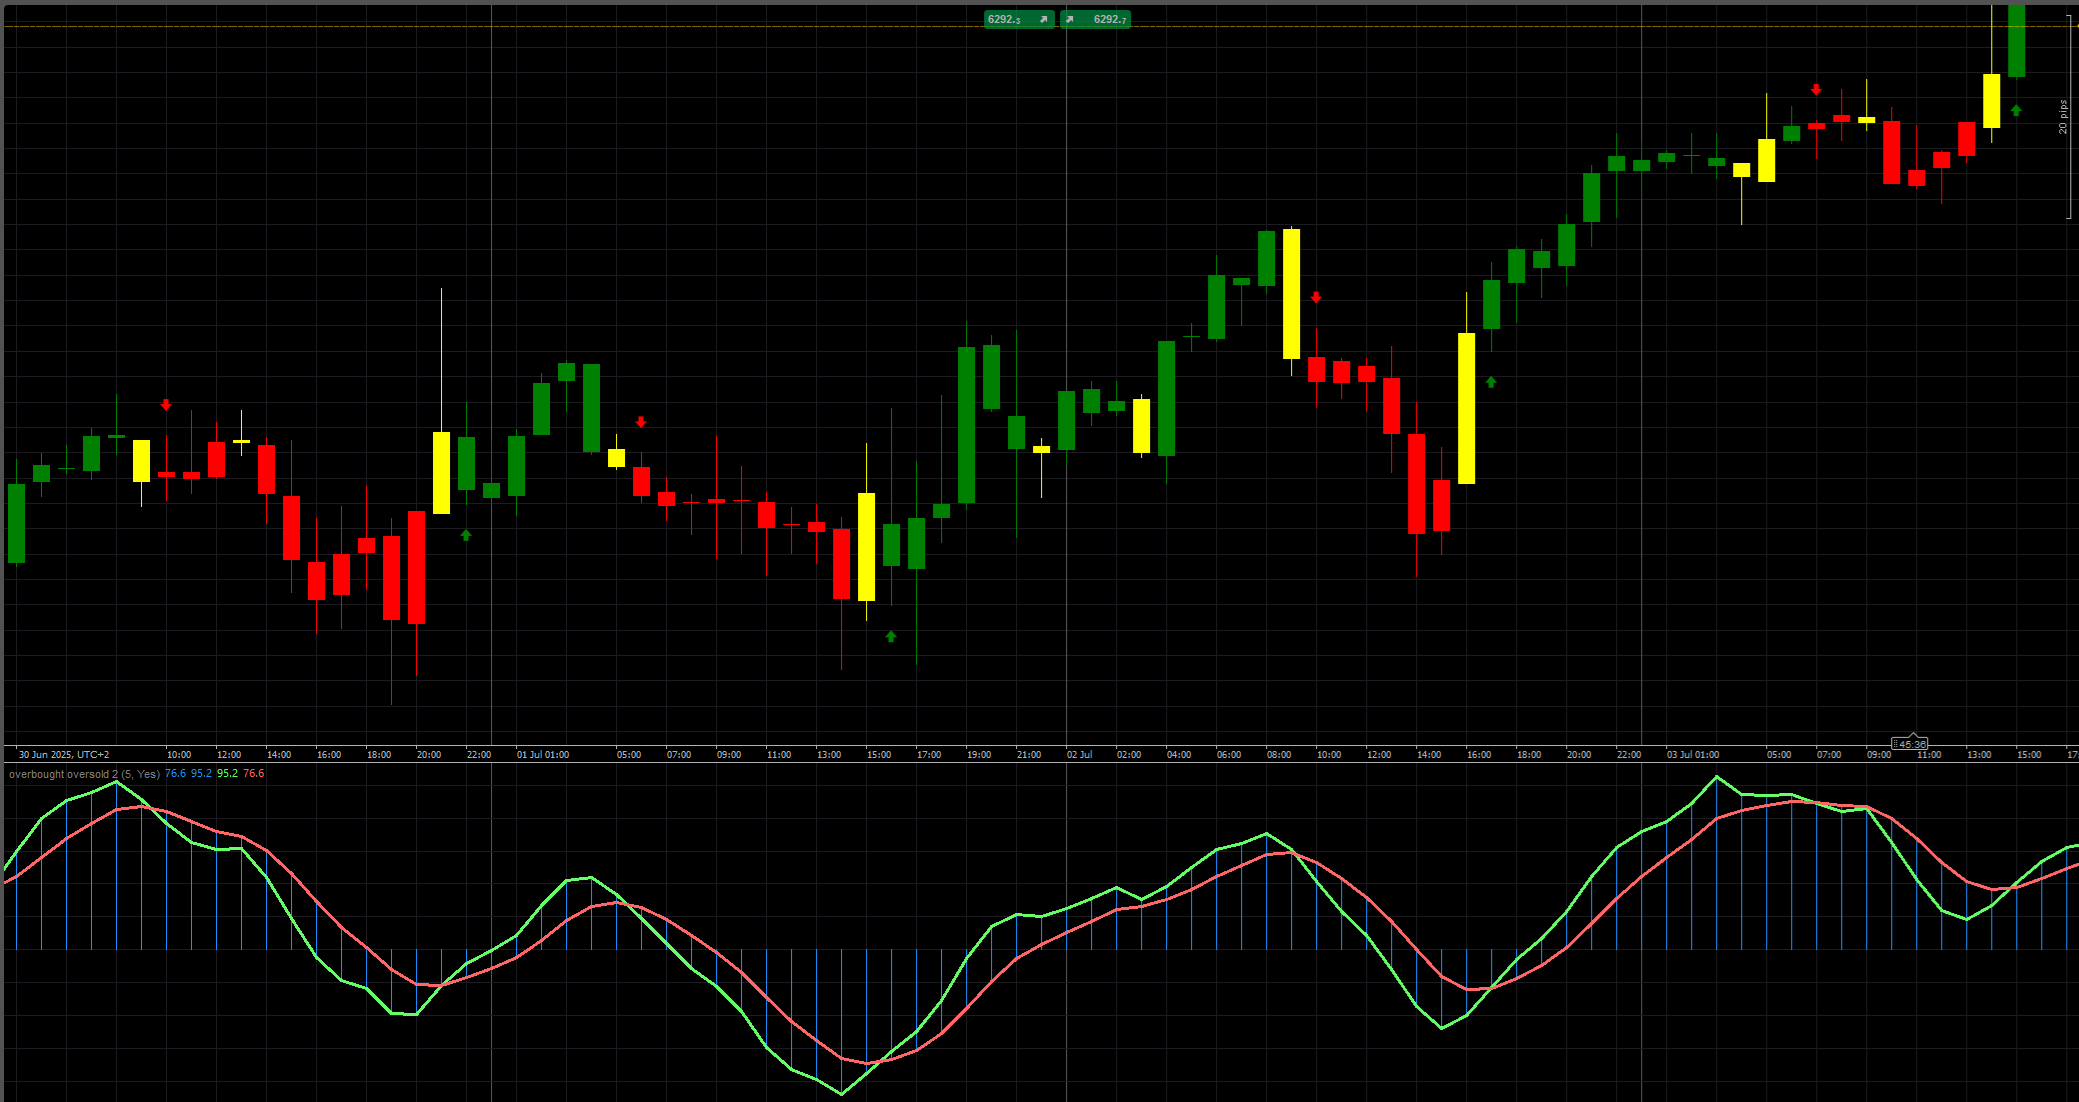
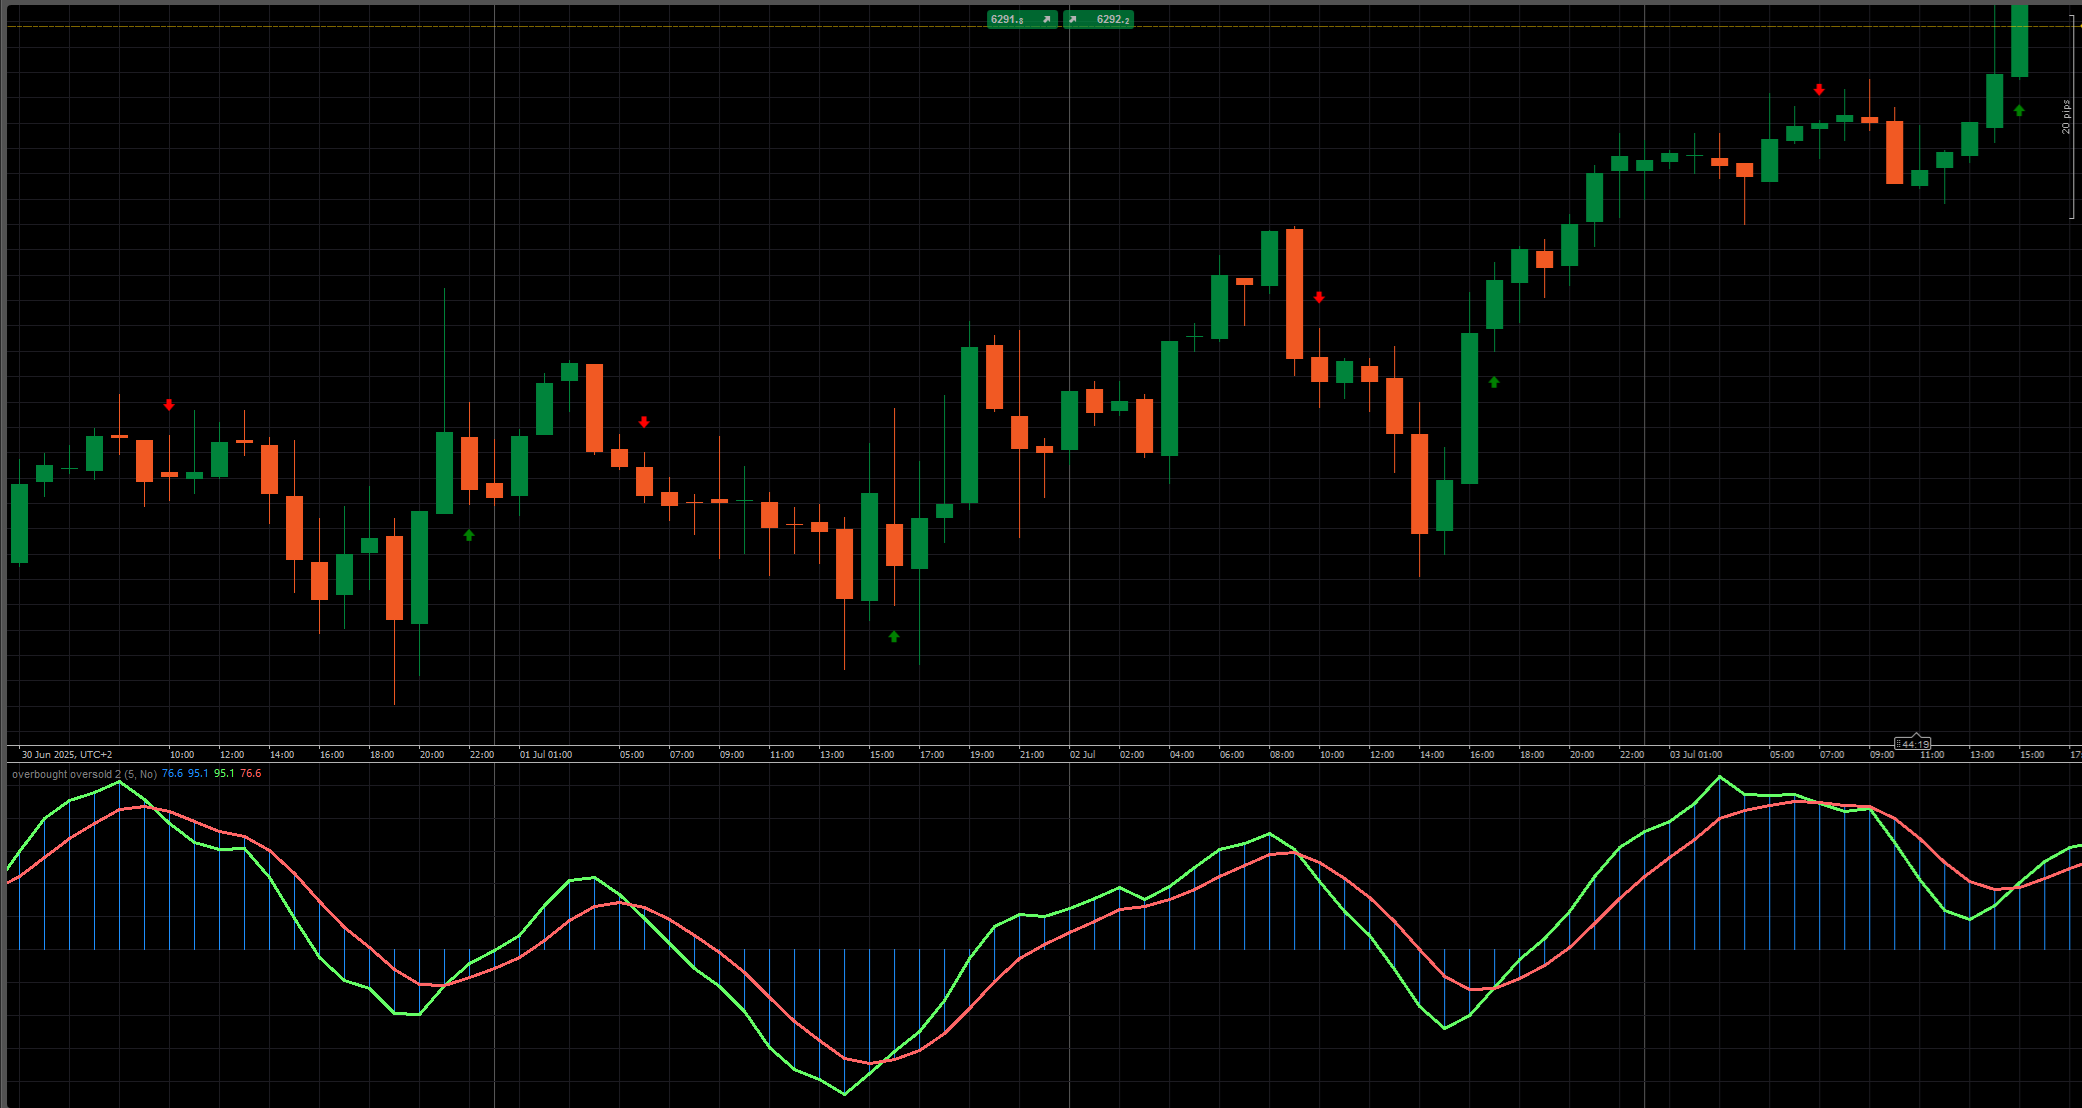

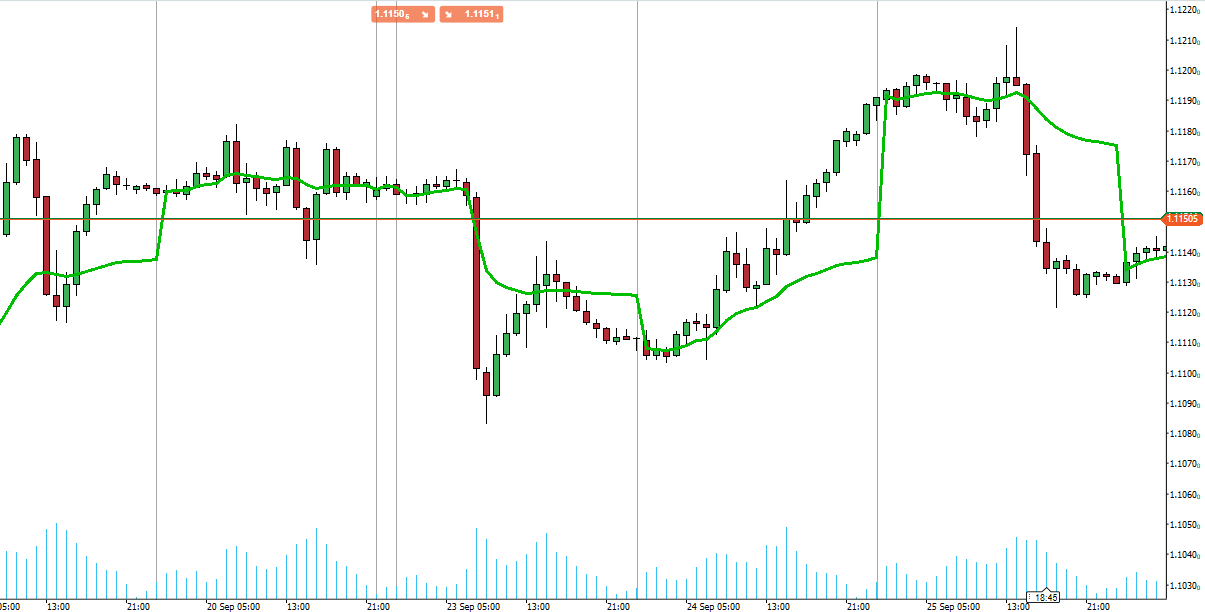
Elevate your timing with the Overbought / Oversold Indicator: it computes a smoothed central price (ys1) via EMA, normalizes momentum through standard deviation, and plots dual histograms (Oo & Ll) alongside up/down EMA lines. Color-coded bars instantly highlight bullish (green), bearish (red) or indecisive (yellow) momentum shifts, while strict crossover arrows mark precise buy and sell points. Add this overlay to your chart for crystal-clear overbought/oversold signals and confidently time your entries and exits!
Also available as CBOT overbought oversold cbot cBot - cTrader Store

You may also like
.jpg)
Popular
Indicator
vwap
RT VWAP
Unlock VWAP in cTrader! Choose anchor periods, price sources, and display deviation bands with real-time tick updates.
Indicator
forex
TrendFibonacci
The TrendFibonacci indicator is a powerful tool for traders, combining Fibonacci retracement levels