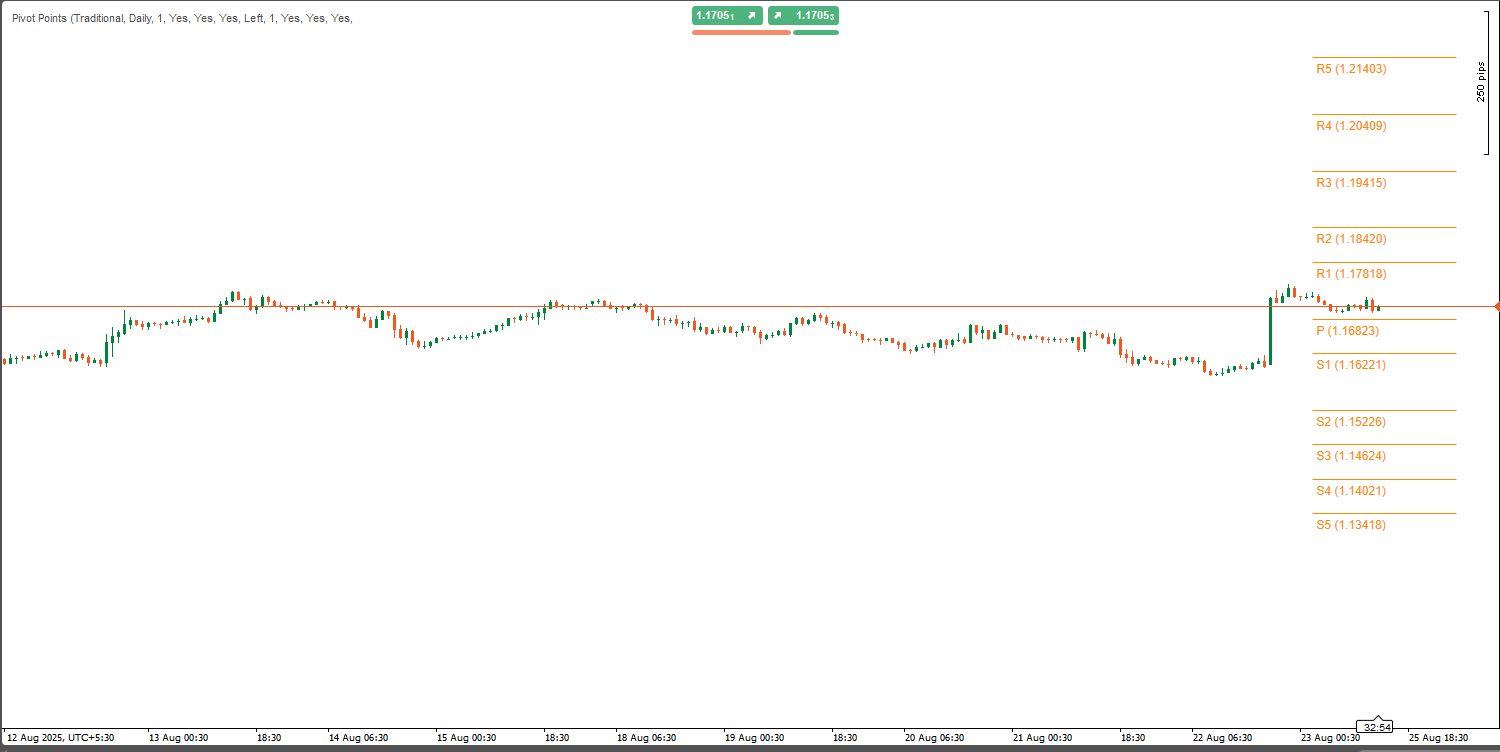
Pivot Point Daily Indicator
.jpg)
23/09/2025
Desktop
Since 30/05/2025
Sales
11
Key Features:
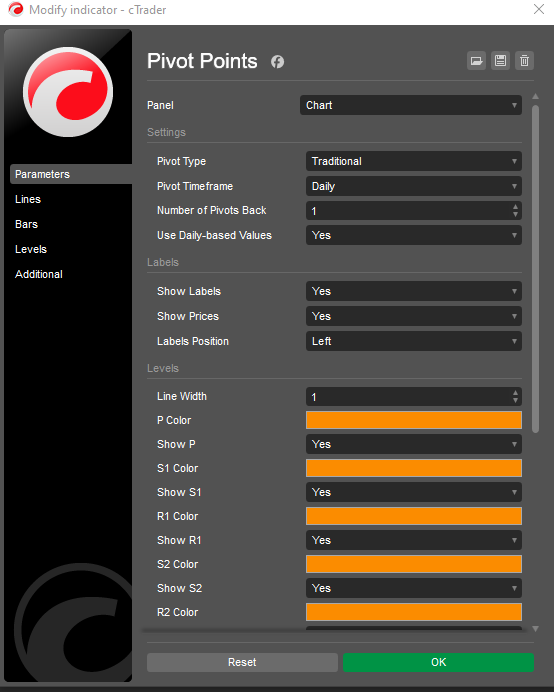
- Multiple Pivot Styles: Seamlessly switch between six pivot calculation methods: Classic, Fibonacci, Woodie, Camarilla, DM, and Traditional. Each method supports varying levels (up to R5/S5 for Traditional and Camarilla, R3/S3 for Fibonacci, and P/R1/S1 for DM).
- Flexible Timeframes: Choose from a wide range of pivot timeframes, including Auto, Daily, Weekly, Monthly, Quarterly, Yearly, and multi-year options (Biyearly, Triyearly, Quinquennially, Decennially). Perfect for aligning with your trading horizon.
- Historical Pivot Control: Set the number of historical pivot sets to display (1–200) with the Number of Pivots Back parameter, ensuring a clutter-free chart while preserving key historical levels.
- Customizable Appearance: Fully adjustable colors, line widths, and label settings. Toggle labels and price values on/off, and choose label positions (Left or Right) with smart vertical offsets for clarity.
- Daily or Intraday Data: Option to use daily-based values or chart timeframe data, providing flexibility for different trading strategies.
- Optimized Performance: Lightweight, native cTrader code ensures fast, real-time updates without lag, compatible with Forex, indices, commodities, crypto, and more.
Why Choose Pivot Points Standard?
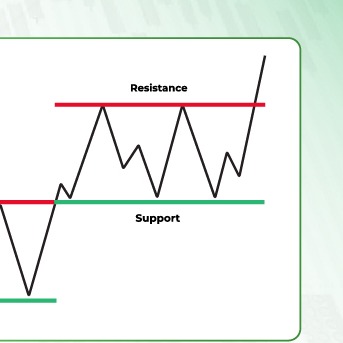
- Versatile Trading Tool: Identify key support/resistance levels, trend directions, and breakout opportunities across any market or timeframe.
- User-Friendly Interface: Intuitive dropdown menus for pivot type, timeframe, and label position make customization a breeze.
- Historical Analysis: Visualize up to 200 historical pivot sets to study past price interactions and refine your strategy.
- Clean Charting: Smart label positioning and customizable line lengths prevent chart clutter, enhancing readability.
How to Use:
- Apply the indicator to your cTrader chart.
- Select your preferred Pivot Type (e.g., Fibonacci, Camarilla) and Pivot Timeframe (e.g., Daily, Monthly).
- Adjust Number of Pivots Back to control historical sets displayed.
- Customize colors, line widths, and label settings to suit your style.
- Use pivot levels to identify support/resistance, set stop-loss/take-profit, or trade breakouts.
Ideal For:
- Day Traders: Leverage Daily or Weekly pivots for intraday entries and exits.
- Swing Traders: Use Monthly or Quarterly pivots to capture longer-term trends.
- Scalpers: Combine with lower timeframes for quick, precise trades.
- All Markets: Works seamlessly across Forex, stocks, crypto, and commodities.
Boost Your Trading Confidence
With Pivot Points Standard, you gain access to a powerful, all-in-one tool that simplifies technical analysis and enhances your ability to spot high-probability trading opportunities. Whether you’re a beginner or a seasoned trader, this indicator adapts to your strategy, providing clear, actionable levels to elevate your trading game.Try Pivot Points Standard today and take control of your trading with precision and clarity!One-time payment. Lifetime access. Future updates included.
More from this author
You may also like
.jpeg)
.jpeg)