Side Volume Profile
28/08/2025
1
Desktop
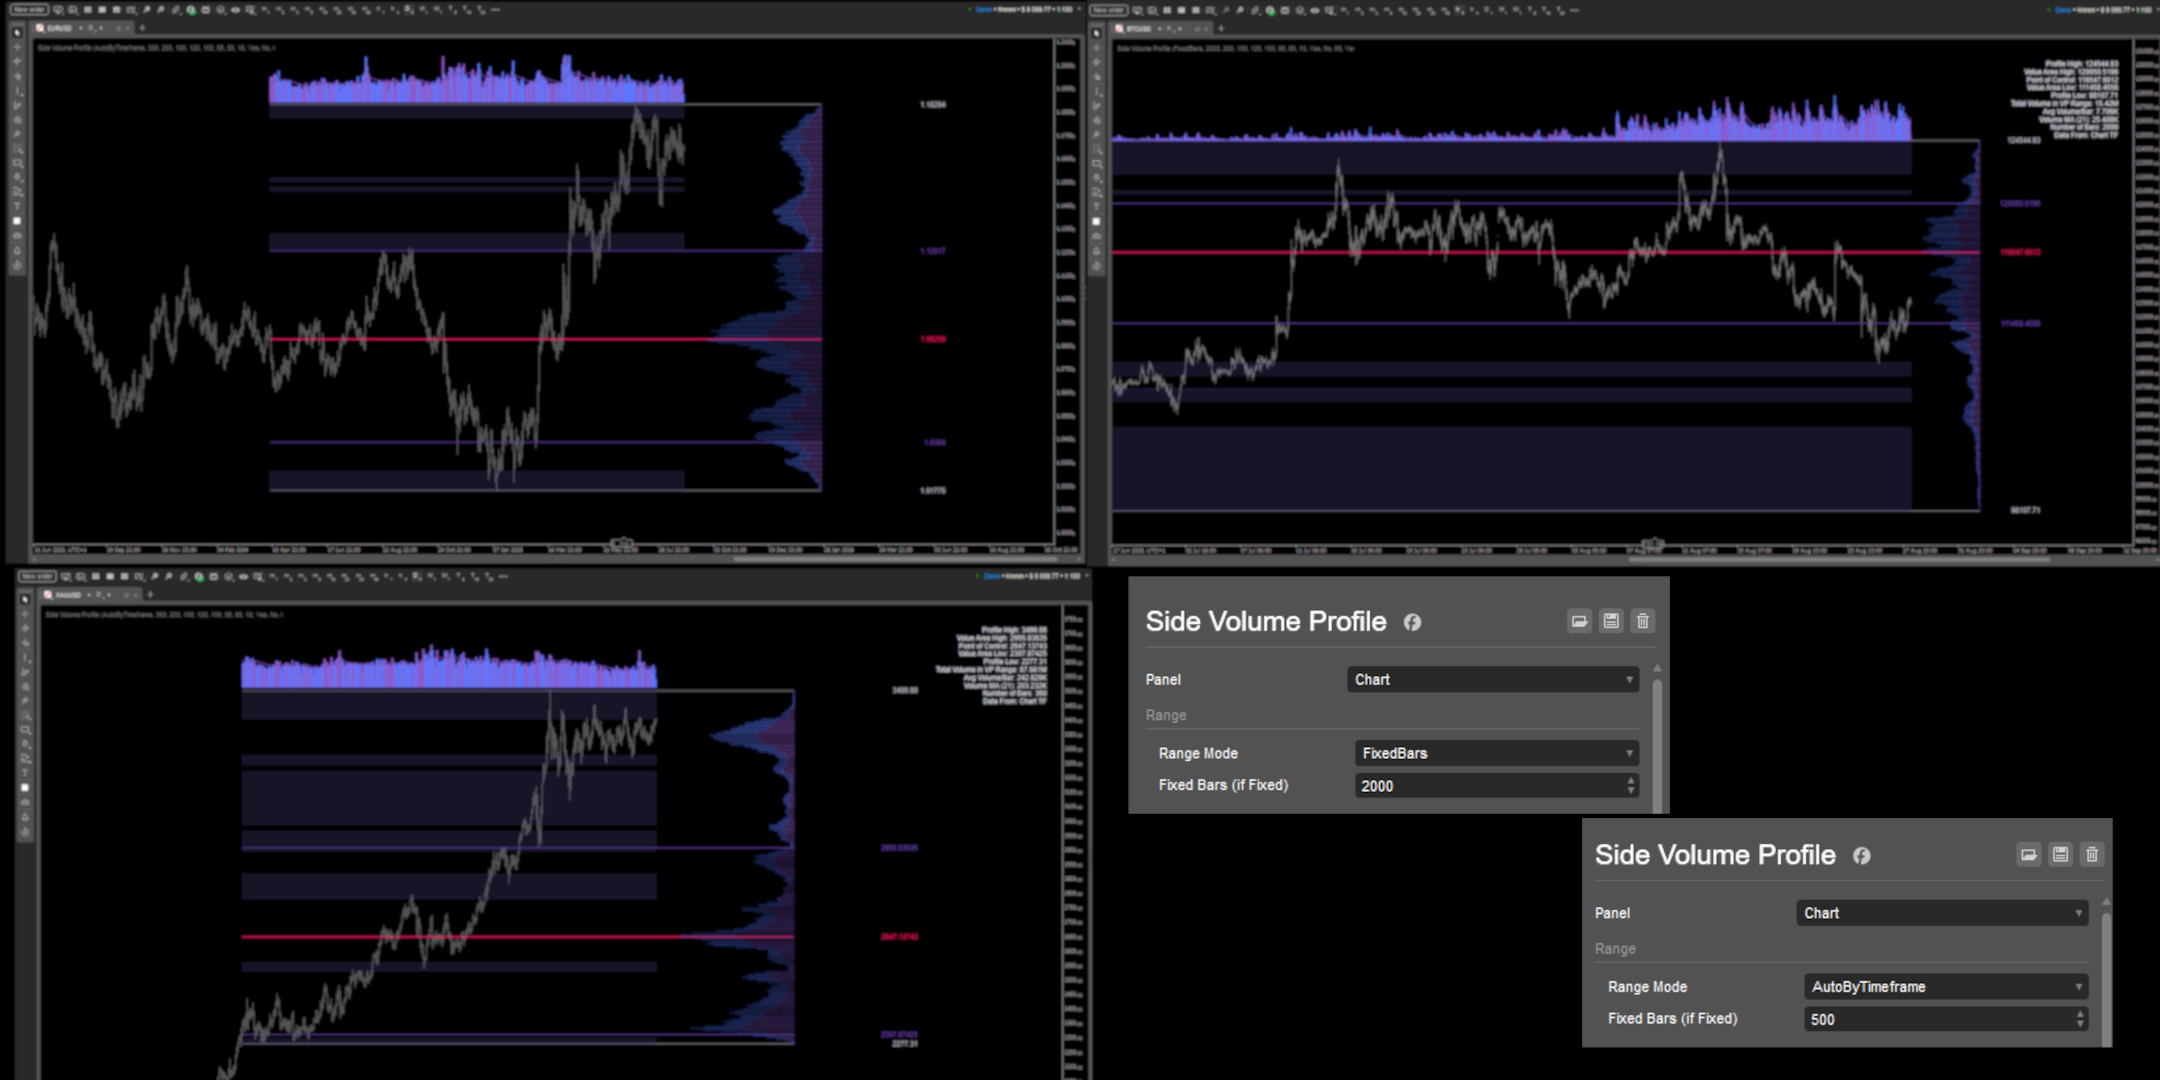
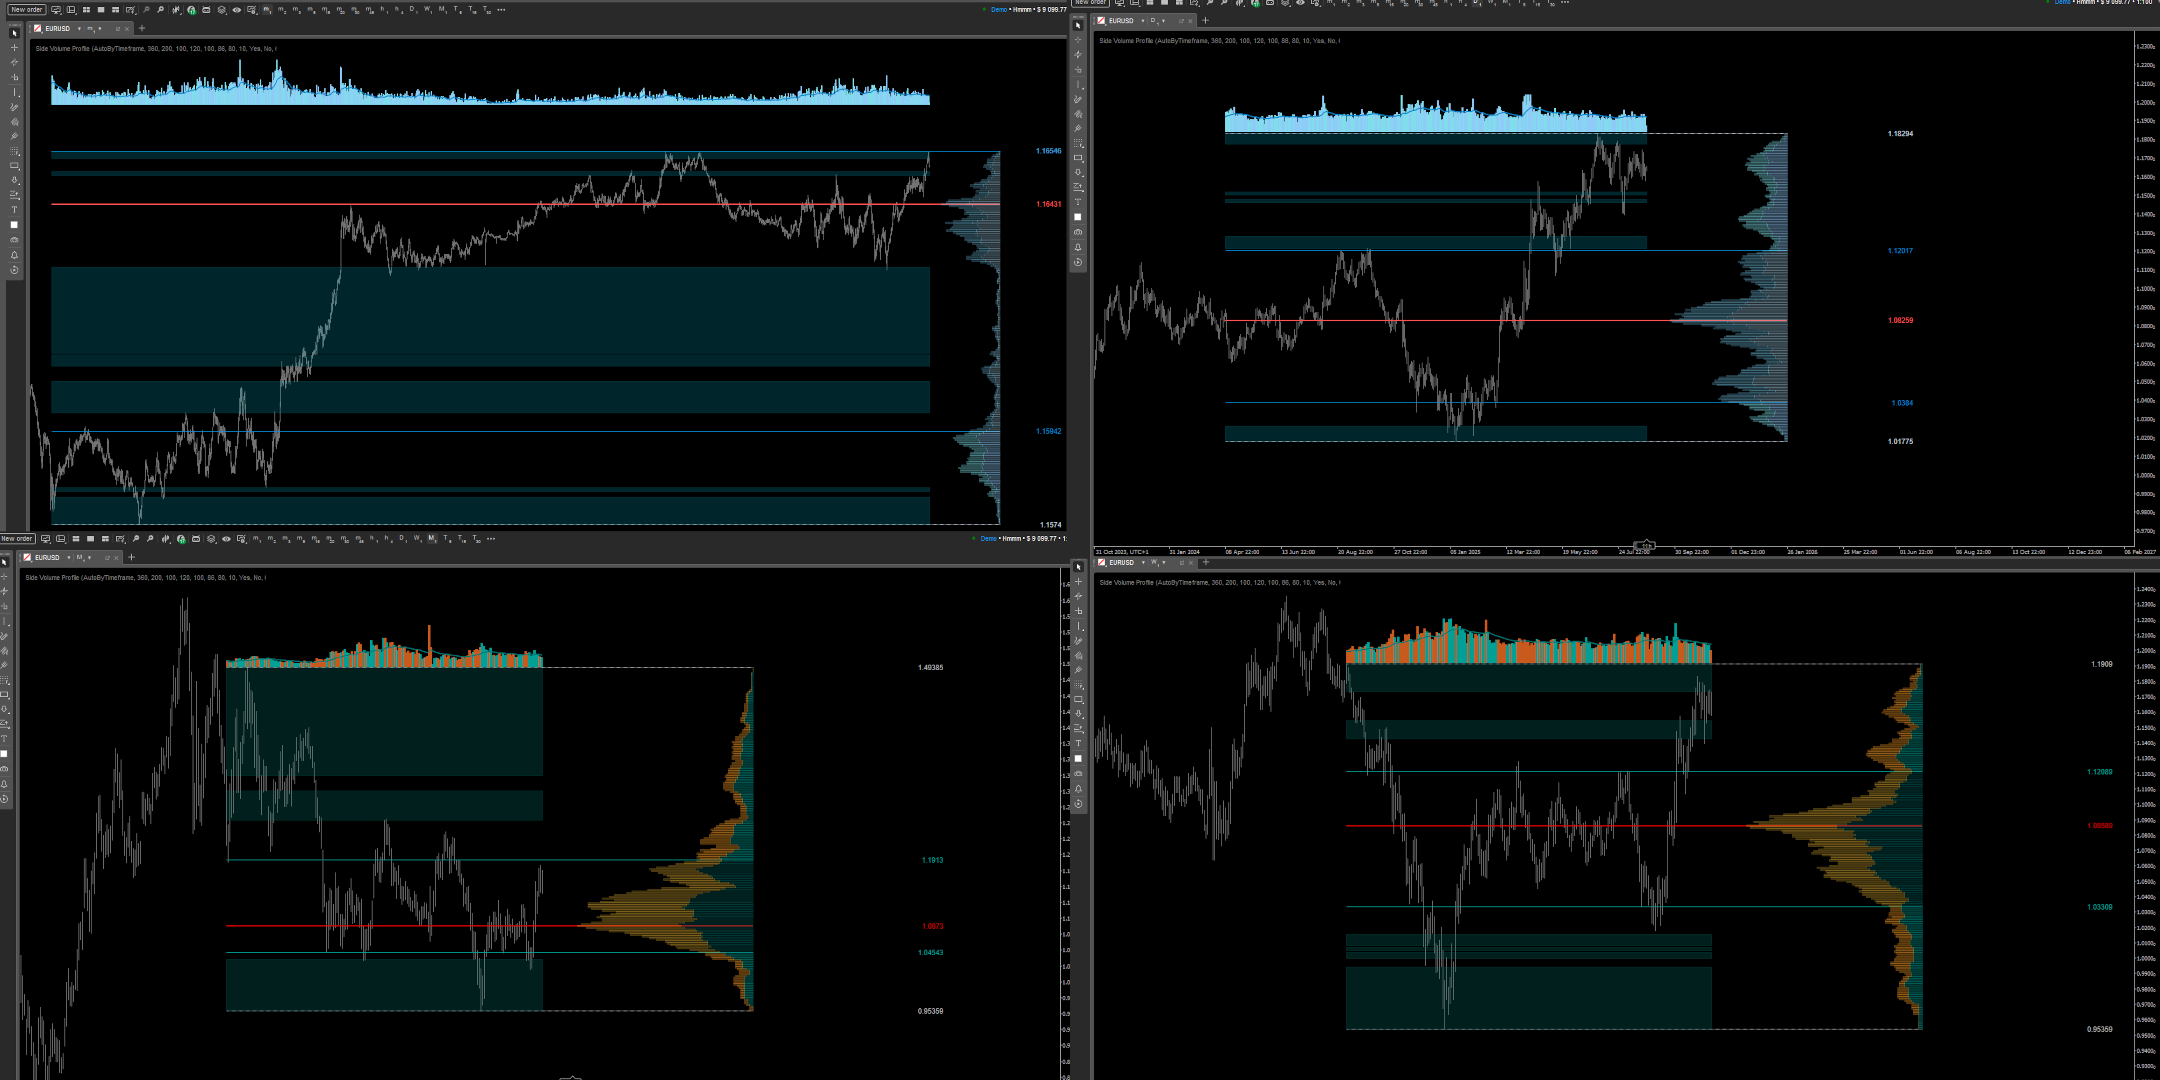
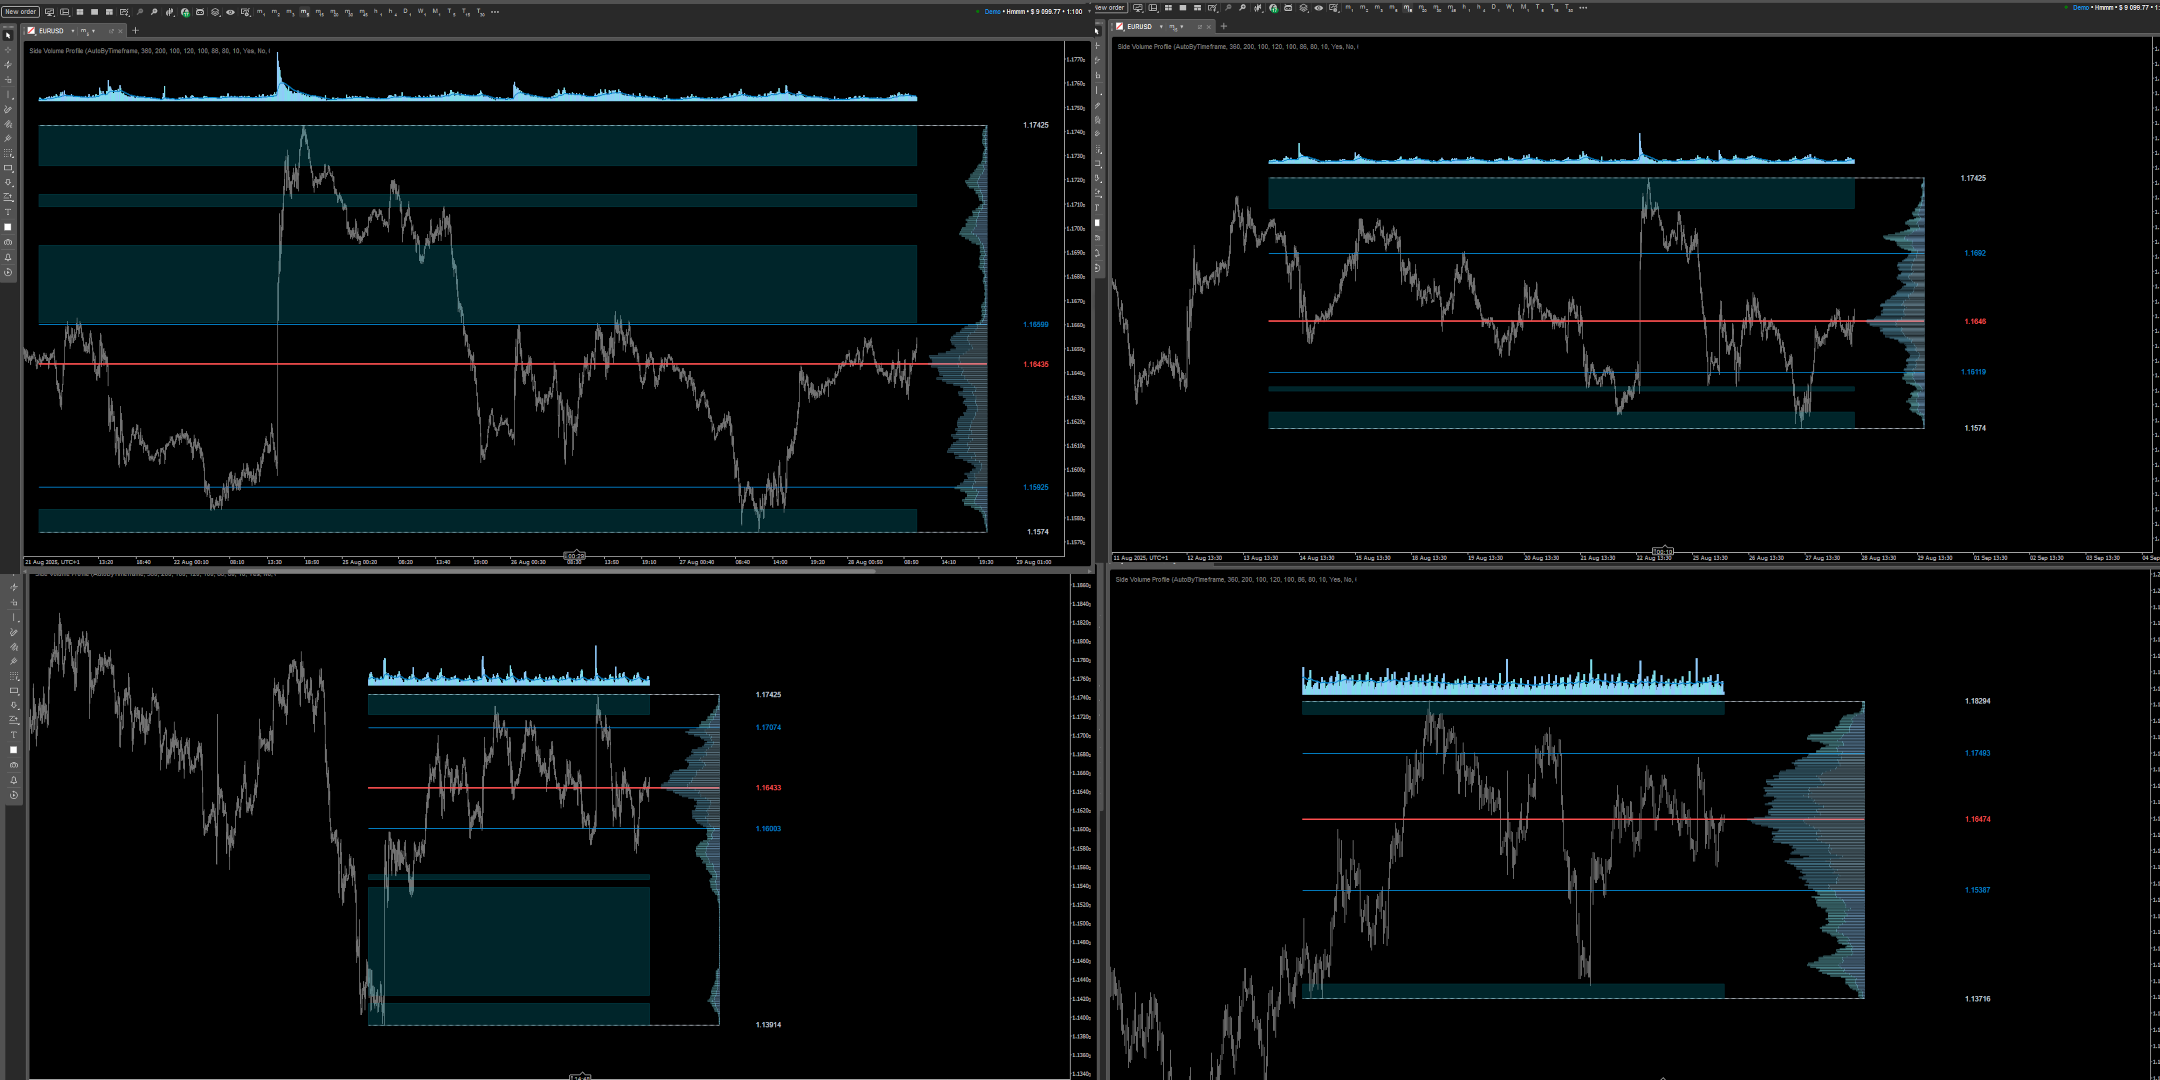
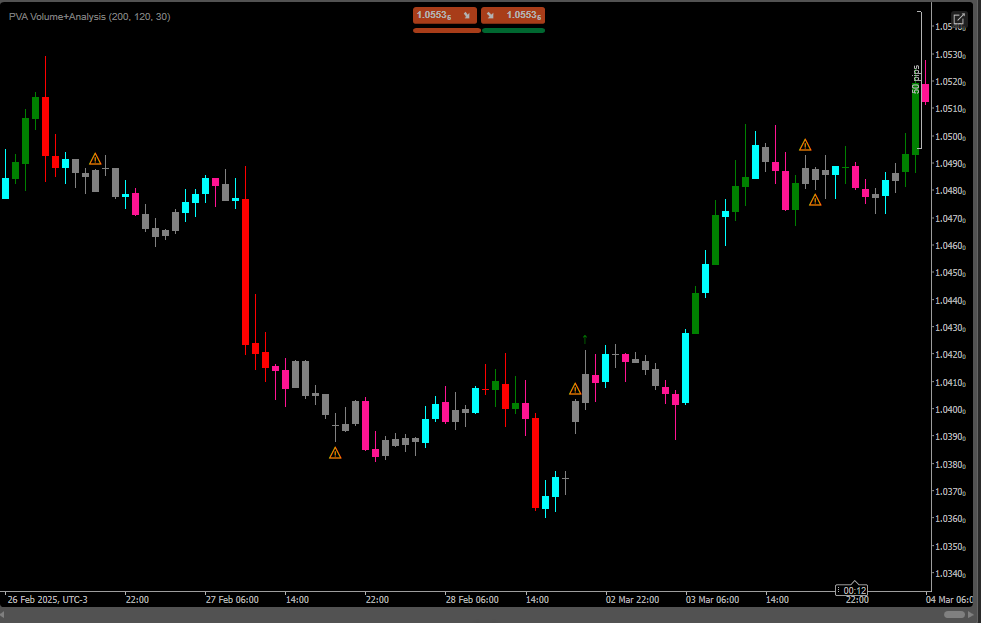
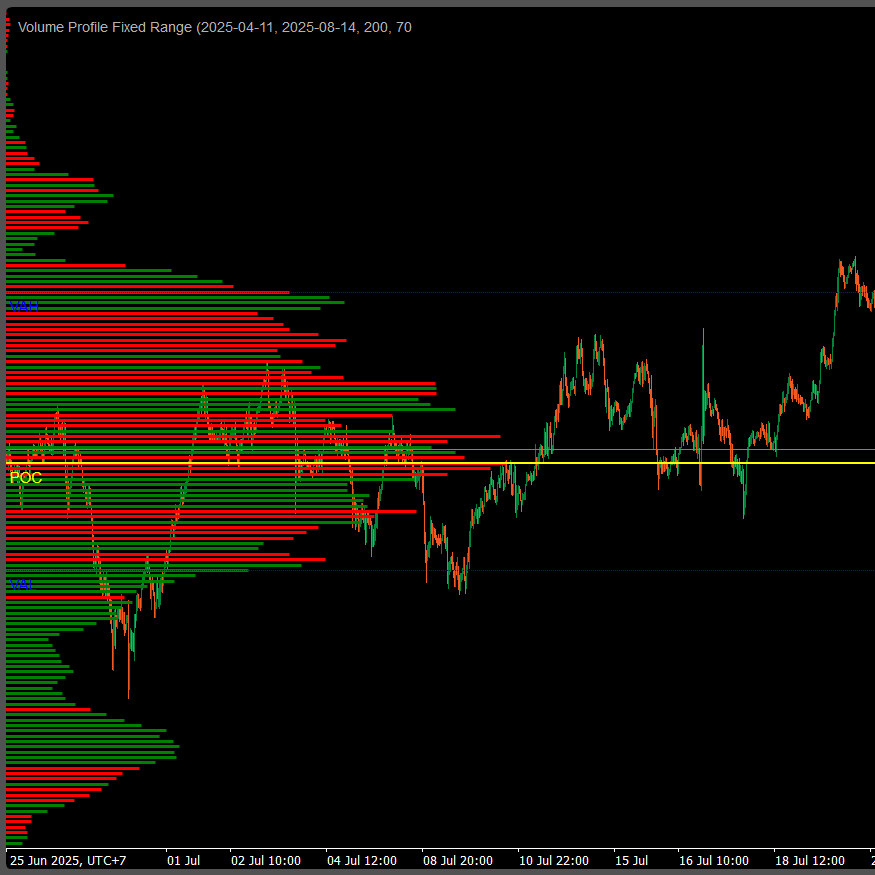
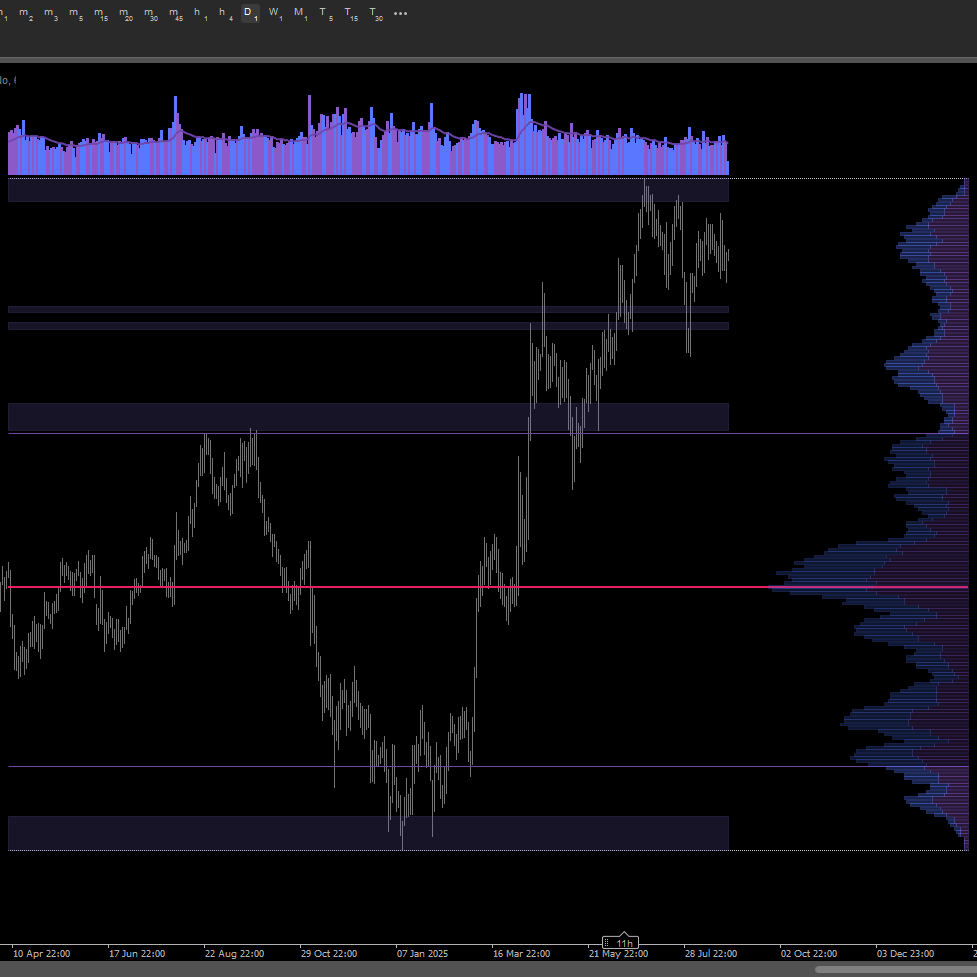
A right-side Volume Profile, that is always pinned to the last bars and doesn’t jump when you pan the chart. It computes volume-by-price over a chosen range (auto by timeframe or a fixed bar count), shows POC, VAH/VAL, profile bounds (High/Low), highlights low-volume zones (LVZ), and draws a volume histogram with EMA above the range (offset in pips). Includes a top-right stats panel, several high-contrast palettes plus custom colors, global bin opacity, width/offset controls, and per-line thickness/style. Built for readability and performance.
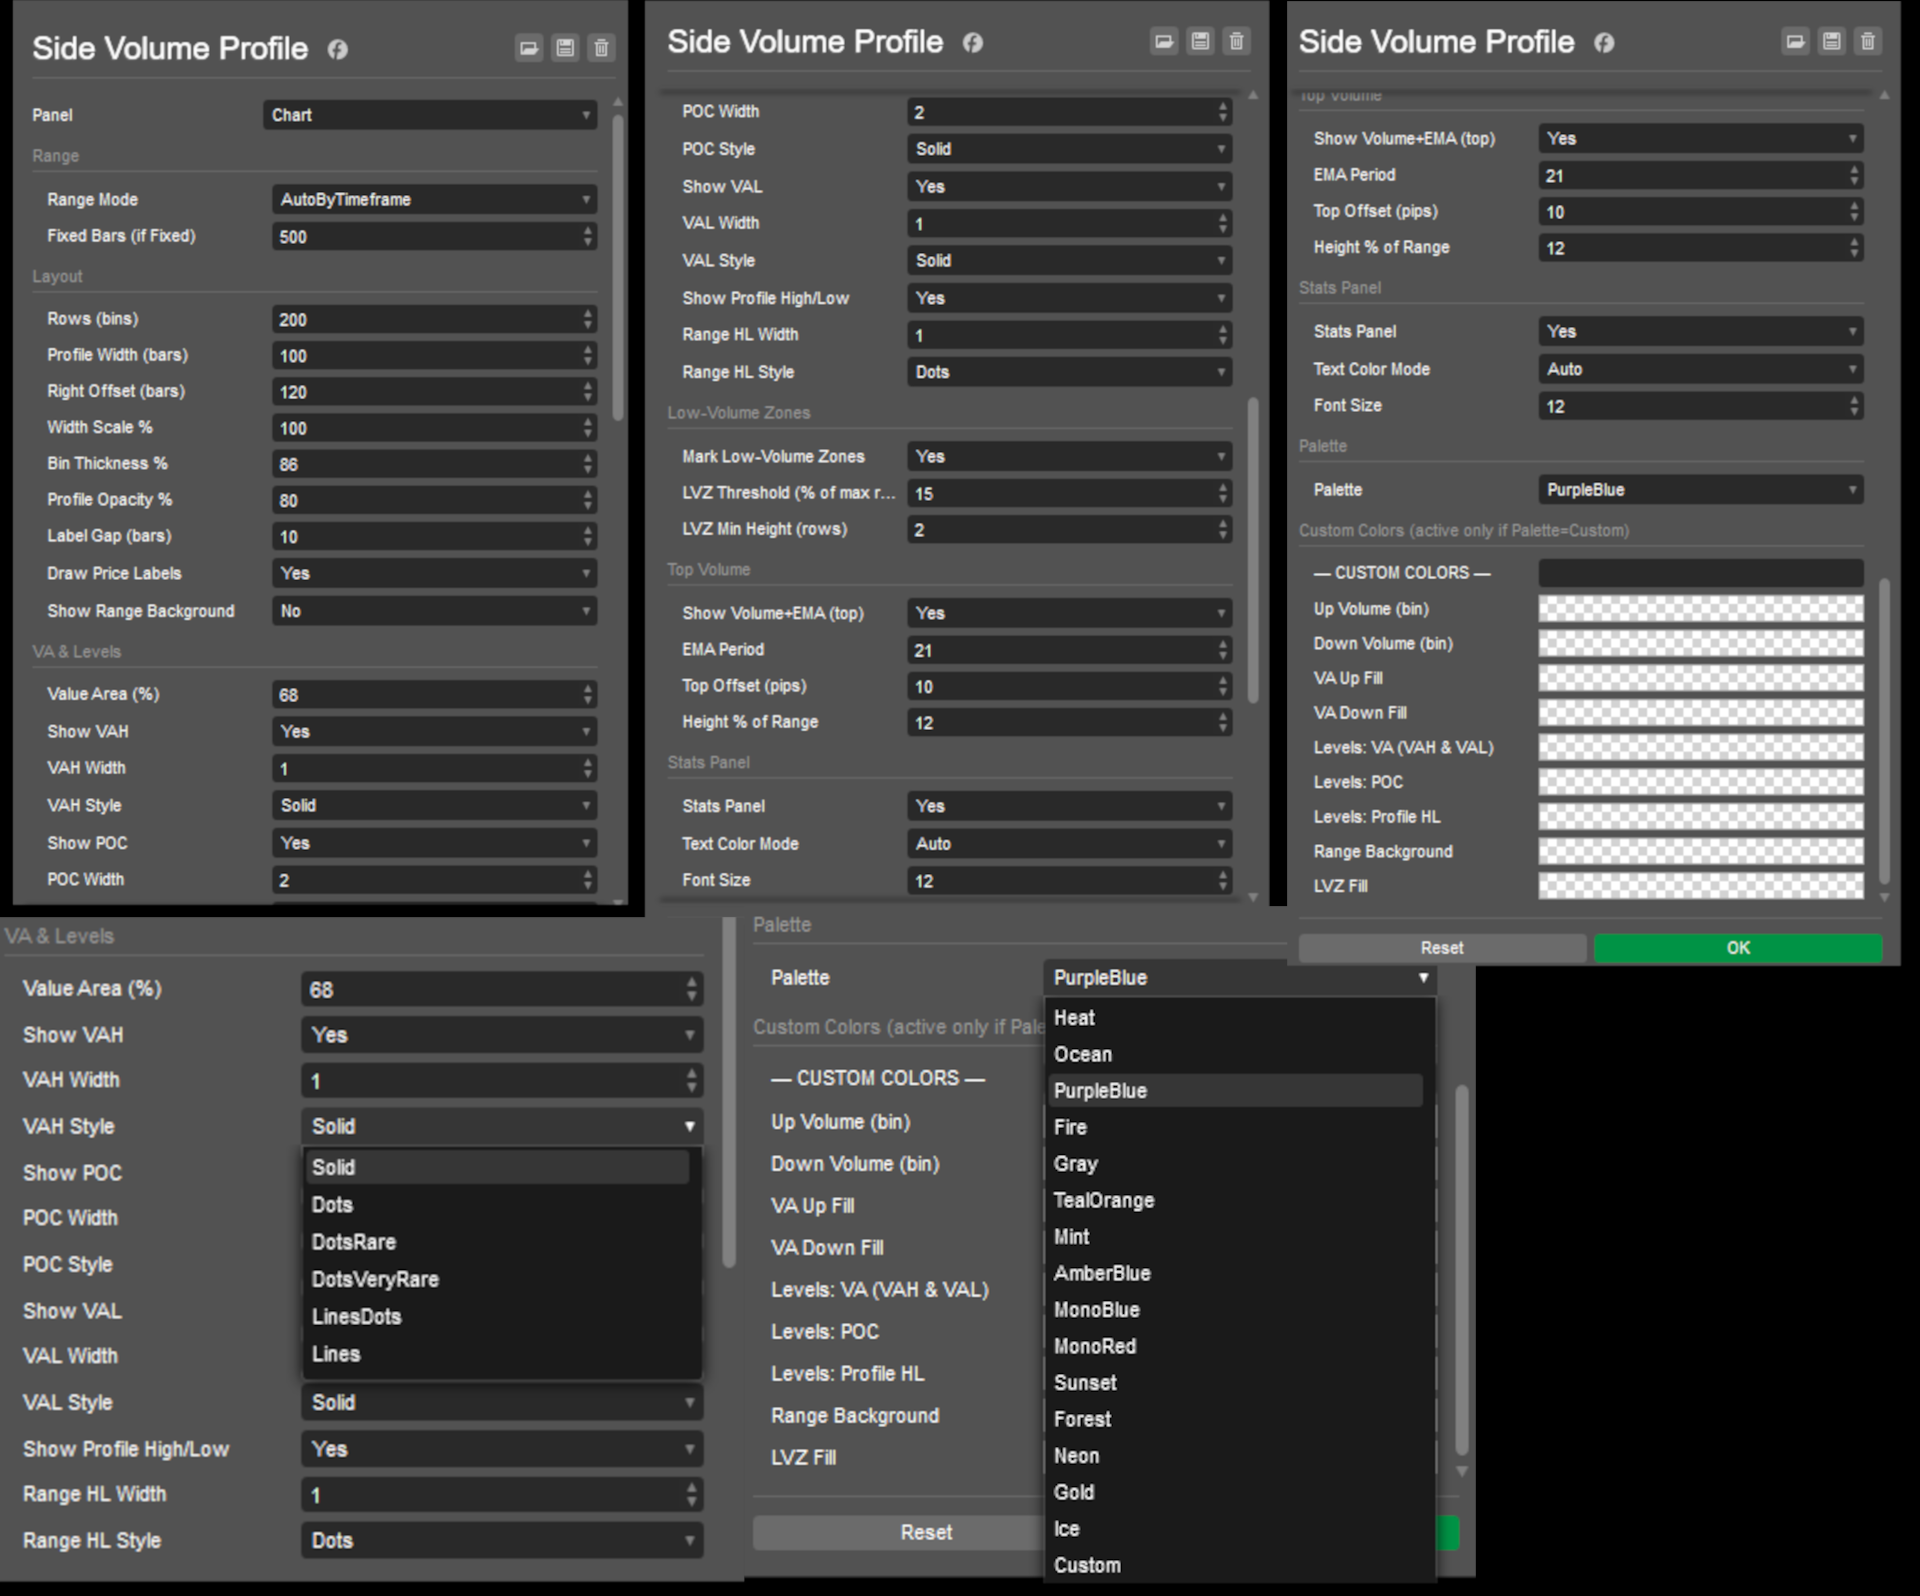
- Range: AutoByTimeframe or FixedBars.
- Layout: Rows (bins), Profile Width / Width Scale, Right Offset, Bin Thickness, Label Gap, profile opacity; optional range background.
- VA & Levels: Value Area %, toggle VAH/POC/VAL, per-level line width & style; profile High/Low.
- Low-Volume Zones: Threshold (% of max row) and minimum height (rows).
- Top Volume: EMA period, height (% of range), default offset 10 pips.
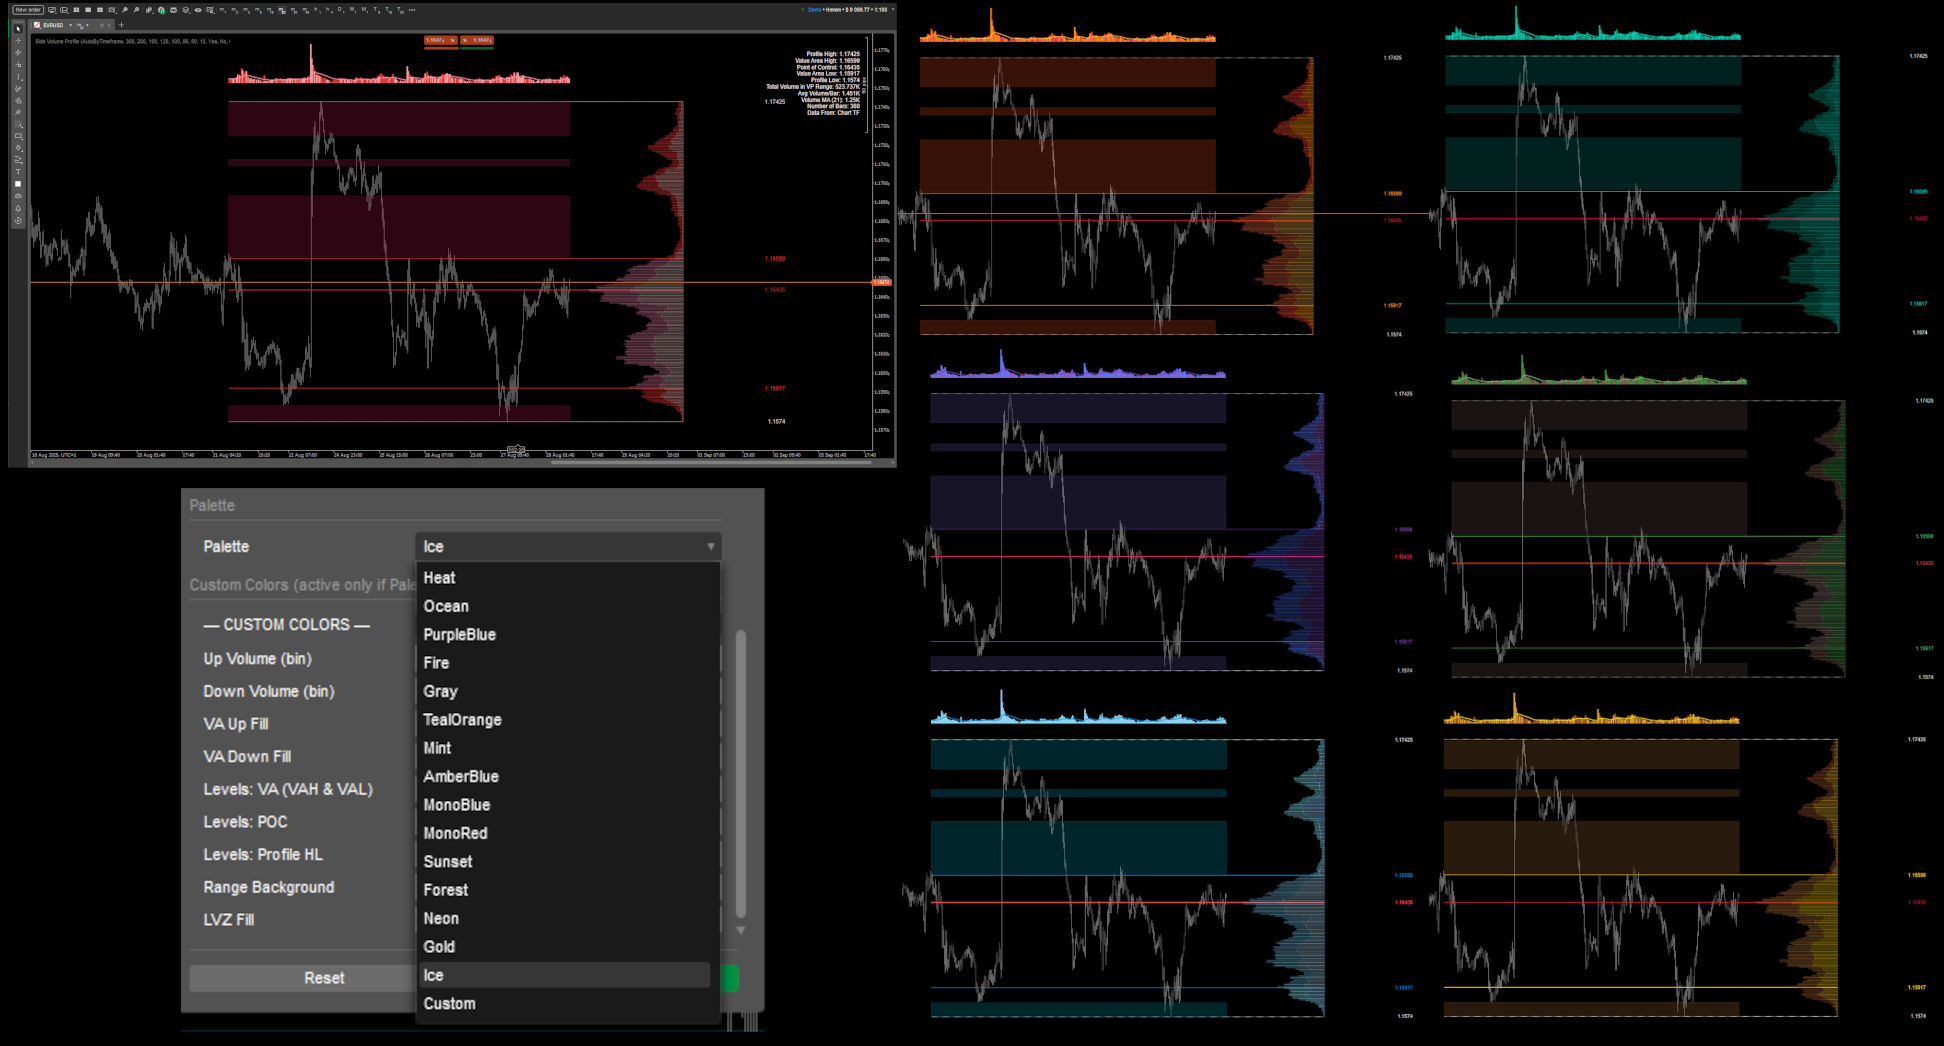
- Palette/Custom: Pick a theme or set your own colors (VAH = VAL).
- Stats Panel: Toggle, font size
More from this author
You may also like