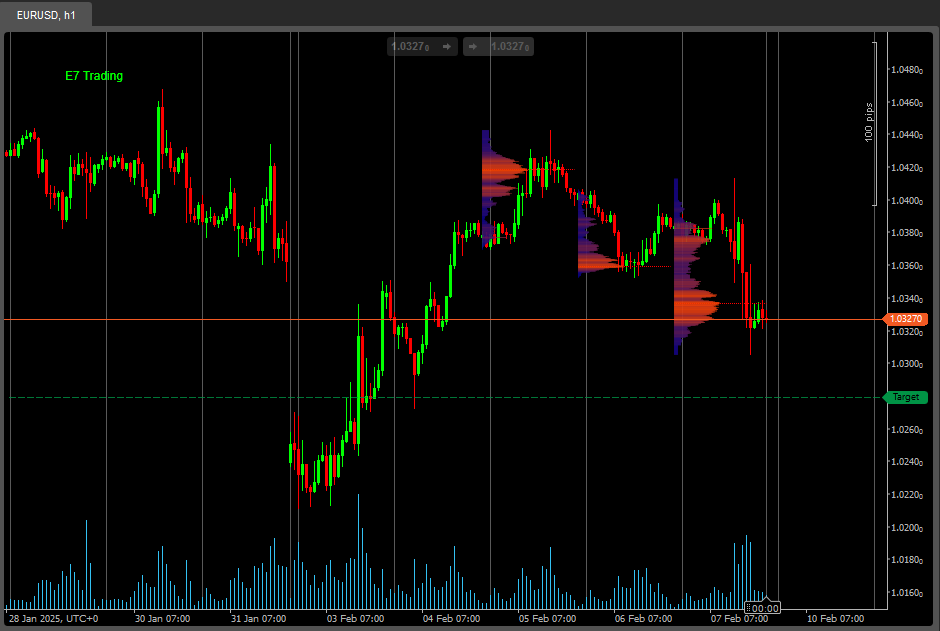
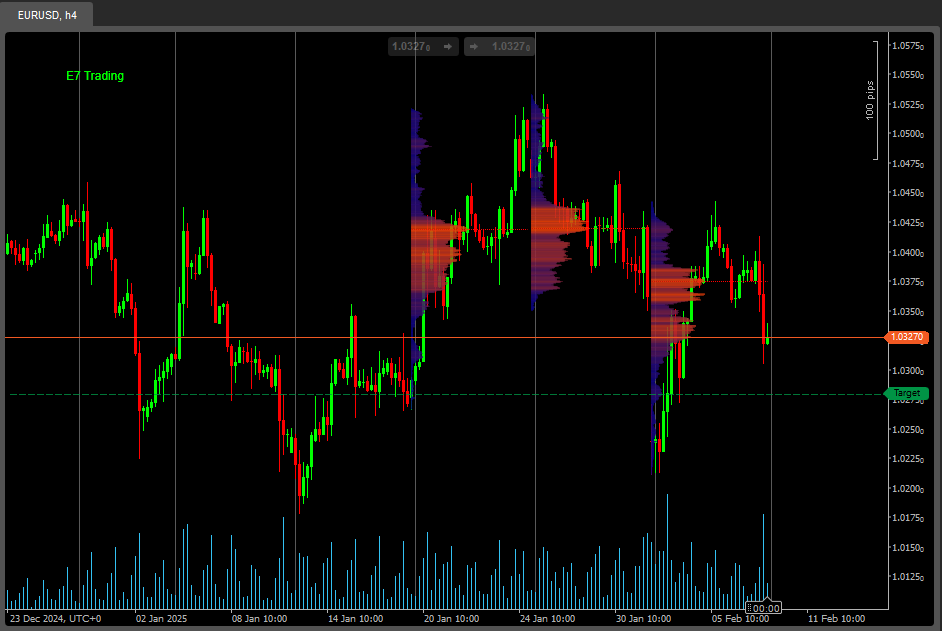
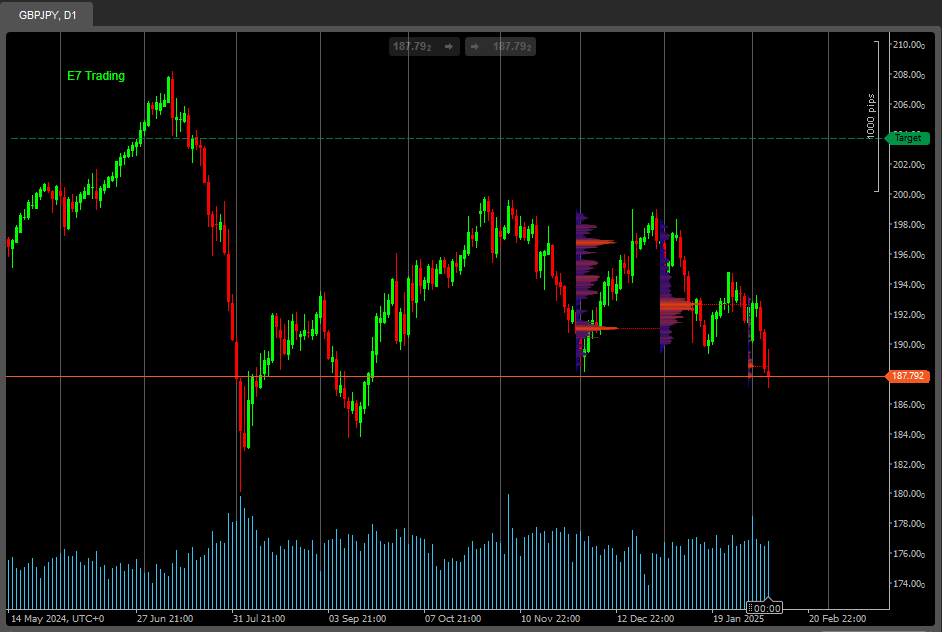
"E7 Volume Profile" logo
E7 Volume Profile
5.0
03/09/2025
499
Desktop
"E7 Volume Profile" uploaded image"E7 Volume Profile" uploaded image"E7 Volume Profile" uploaded image
More from this author
E7 Polynomial Regression Channel
Polynomial Regression Channel which also reflects the volatility of the underlying asset.
E7 BBKG Indicator
E7 BBKG indicator with 80% plus accuracy used to show both, possible reversal and trend.
E7 Harmonic Structures Basic
E7 Harmonic Structures Basic.
E7 Correlation Dashboard
E7 Correlation Dashboard.
Indicator
indices
E7 BlackScholes Model
Option pricing using the BlackScholes model and the Math.Numerics packages
Indicator
bollinger
E7 Indicators Free Overlays
Bollinger Band Cloud, Heiken Ashi, Trend Follower and Parabolic SAR.
Indicator
bollinger
E7 Indicators Free Studies
ADXR, KDJ, SineWave, Bollinger Band Volatility and AEOscillator.
E7 BBKG NumSharp Sample
NumSharp and Pandas Sample CODE ONLY!!! Our mission is to make Machine Learning inside cTrader easier for everyone.
E7 cTrader User ID
cTrader ID
You may also like
Indicator
forex
indices
vwap
+14
Volume Profile Pivot Anchored
Anchor volume profiles to pivots with POC, VAH, VAL and real-time insights for clearer trade decisions.
VWAP
Track VWAP for Asia, London, NY, Sydney, Daily, Weekly, Monthly & Custom Sessions. Perfect for FX & intraday trading!
Indicator
forex
prop
commodities
+2
Light-Version BrickAlgo TrendPulse
🚀 Simplify Your Trading Decisions With Powerful Technical Analysis.
Supertrend TV
REAL Supertrend because default Ctrader Supertrend gives different signals
Indicator
forex
ai
prop
+7
Vwap Manav Indi Button
Automated VWAP bot executes trades at key volume-weighted average price zones with adaptive risk management
OHLC PRO by LudwigICT
OHLC PRO – Advanced Session & Market Structure Tool
Indicator
eurusd
gbpusd
nas100
Ema
An exponential moving average based on regular trading hours.
Indicator
breakout
btcusd
eurusd
+6
Multi-Asset Performance Matrix
Visual tool tracking financial assets' % performance across timeframes, highlighting trends with color-coded insights.
Indicator
breakout
AutoLines™ Support & Resistance
FlexSR auto‑detects pivot highs/lows to plot dynamic support & resistance lines Features customizable styling and option
Indicator
forex
crypto
stocks
+1
SmartBot-Volume MACD
a revolutionary indicator that integrates volume into MACD.
SmartLiquidityZonesPRO
Smart Liquidity Zones PRO auto-detects liquidity grabs, wicks, traps & manipulations — trade like the smart money.
MTF Candles
Multi Timeframe Candle drawing. Draw Any candles from any timeframe on your chart :-)
Previous Day Equilibrium (Premium & Discount)
Plots the equilibrium price levels based on previous daily highs and lows.
Candle Timer & Strength Panel Demo -
Candle Timer & Strength Panel DEMO for cTrader DEMO VERSION – 24 hours free trial! This is a DEMO version of the Candle
Indicator
breakout
forex
indices
+8
RSI Trend Trigger
RSI Trend Trigger 📈: Uses dual-layer RSI to spot trends & generate clear buy/sell signals.
FX Market Sessions
Easily visualise Forex sessions with start/end markers and high/low levels for Sydney, Tokyo, London, and New York.
MMXM Structure by Ludwig
MMXM Structure by LudwigICT – Professional Market Structure Mapping Tool
ICT MACRO THEORY
Are essentially short intervals during which the algorithm seeks liquidity or adjusts price.....