swingh6
03/09/2025
75
Desktop
Forex Trend-Following Strategy Explanation (English)
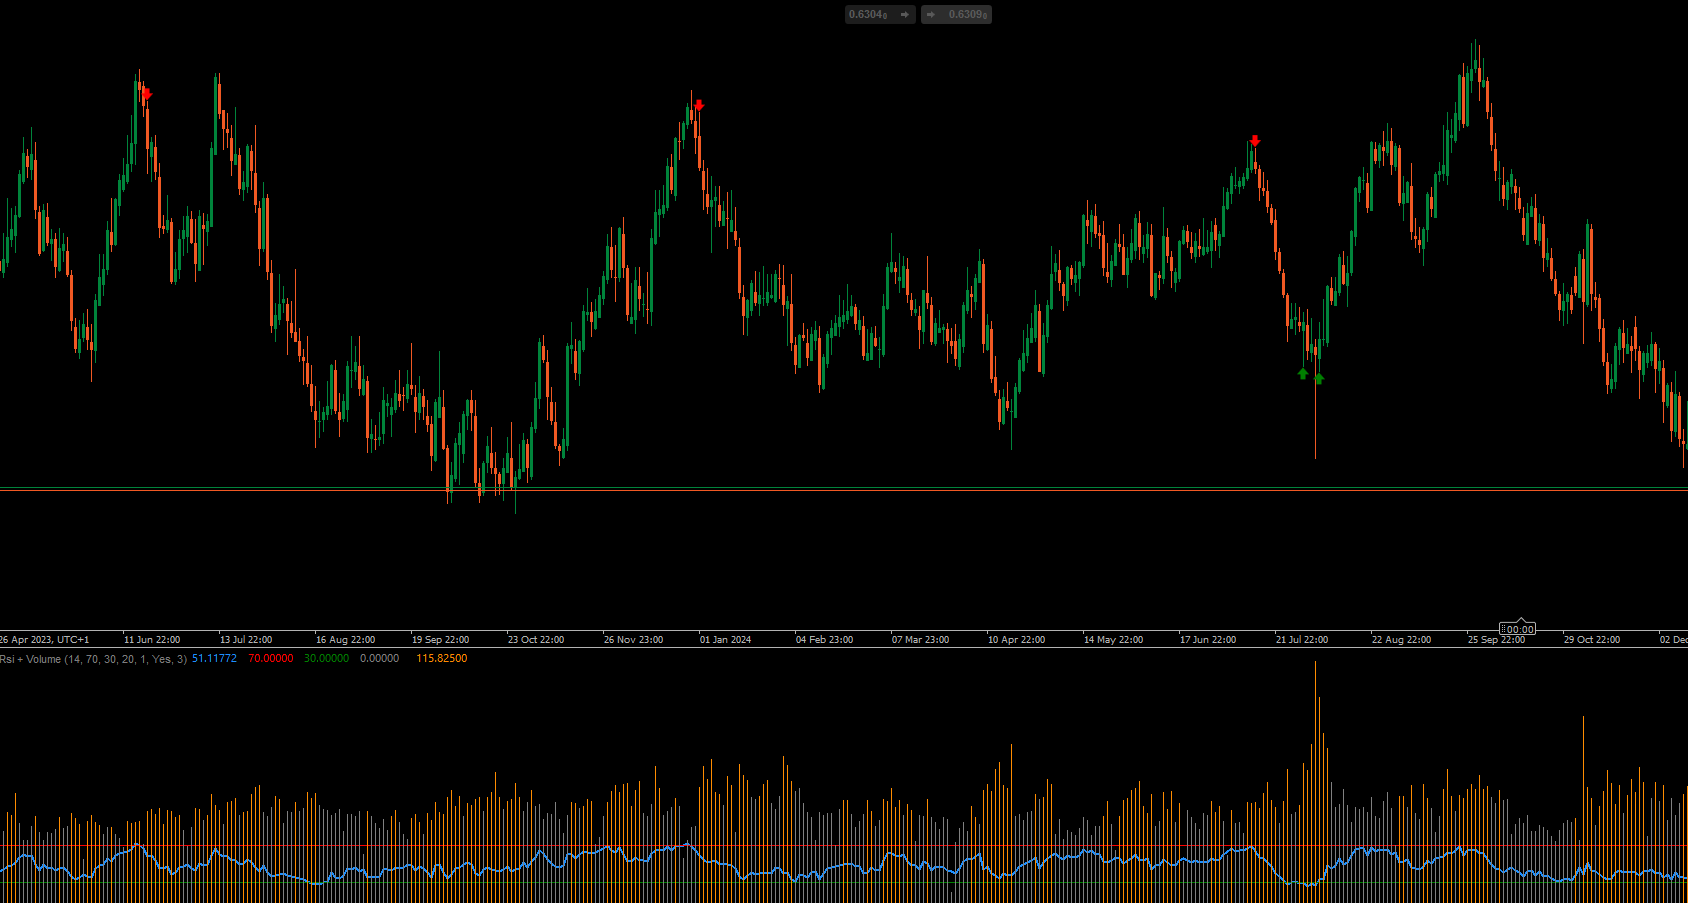
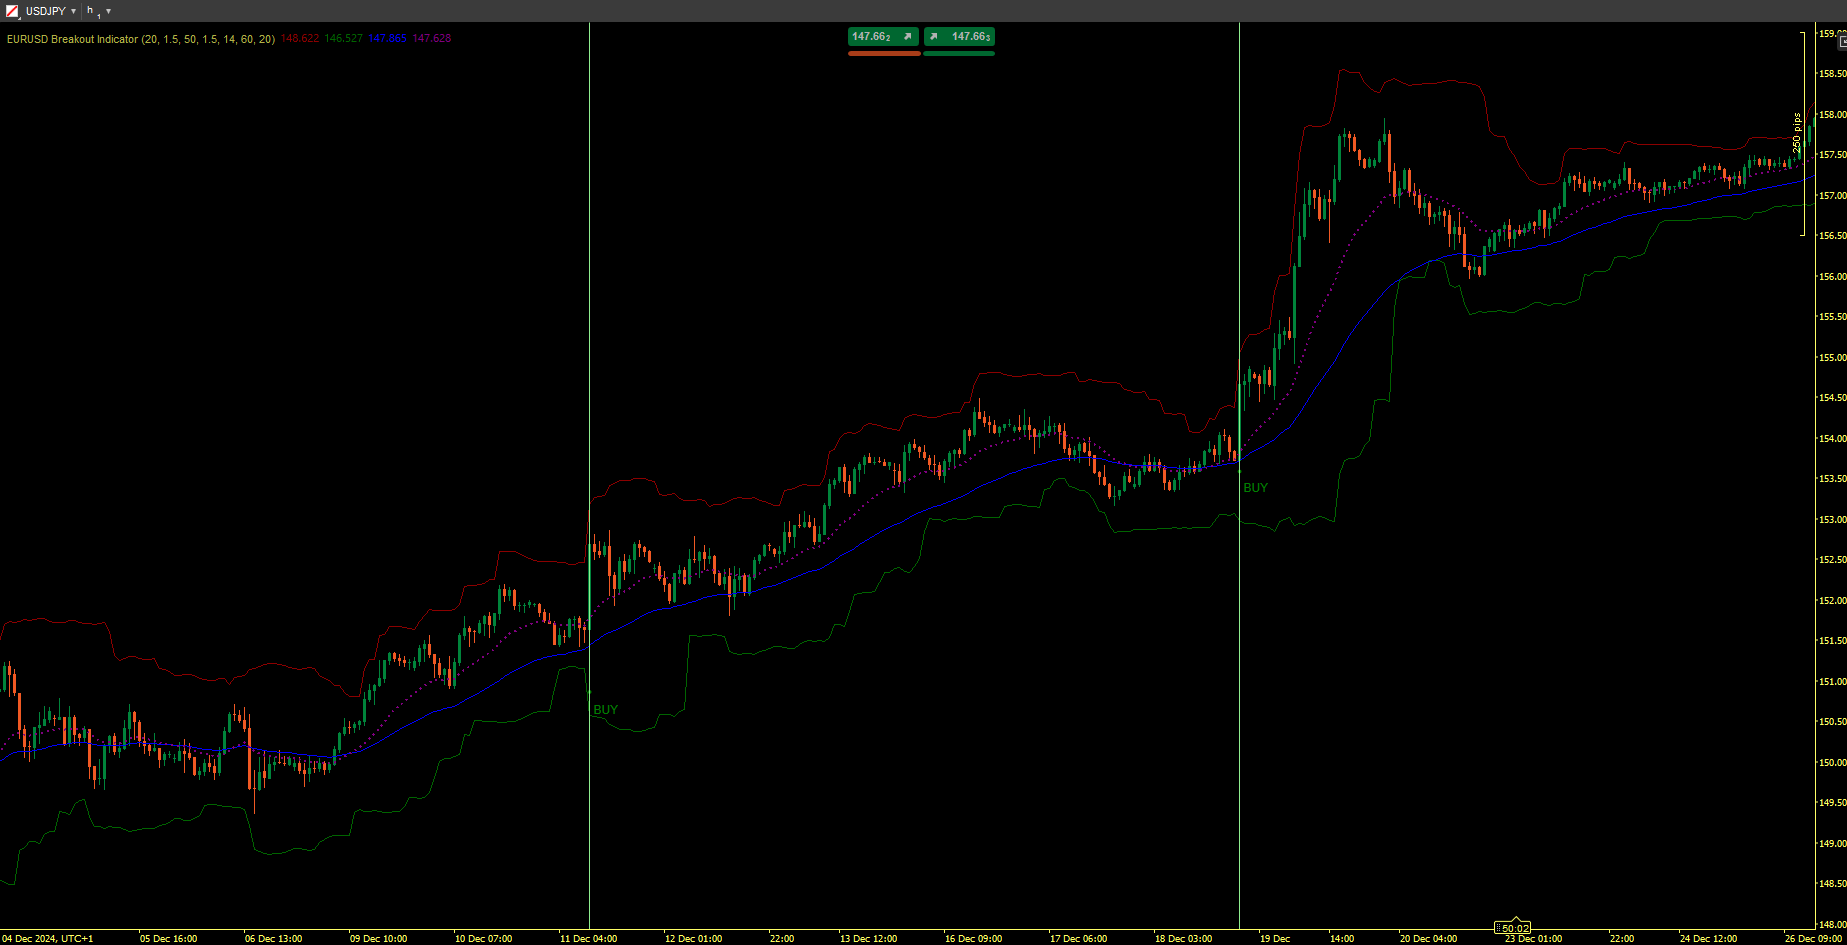
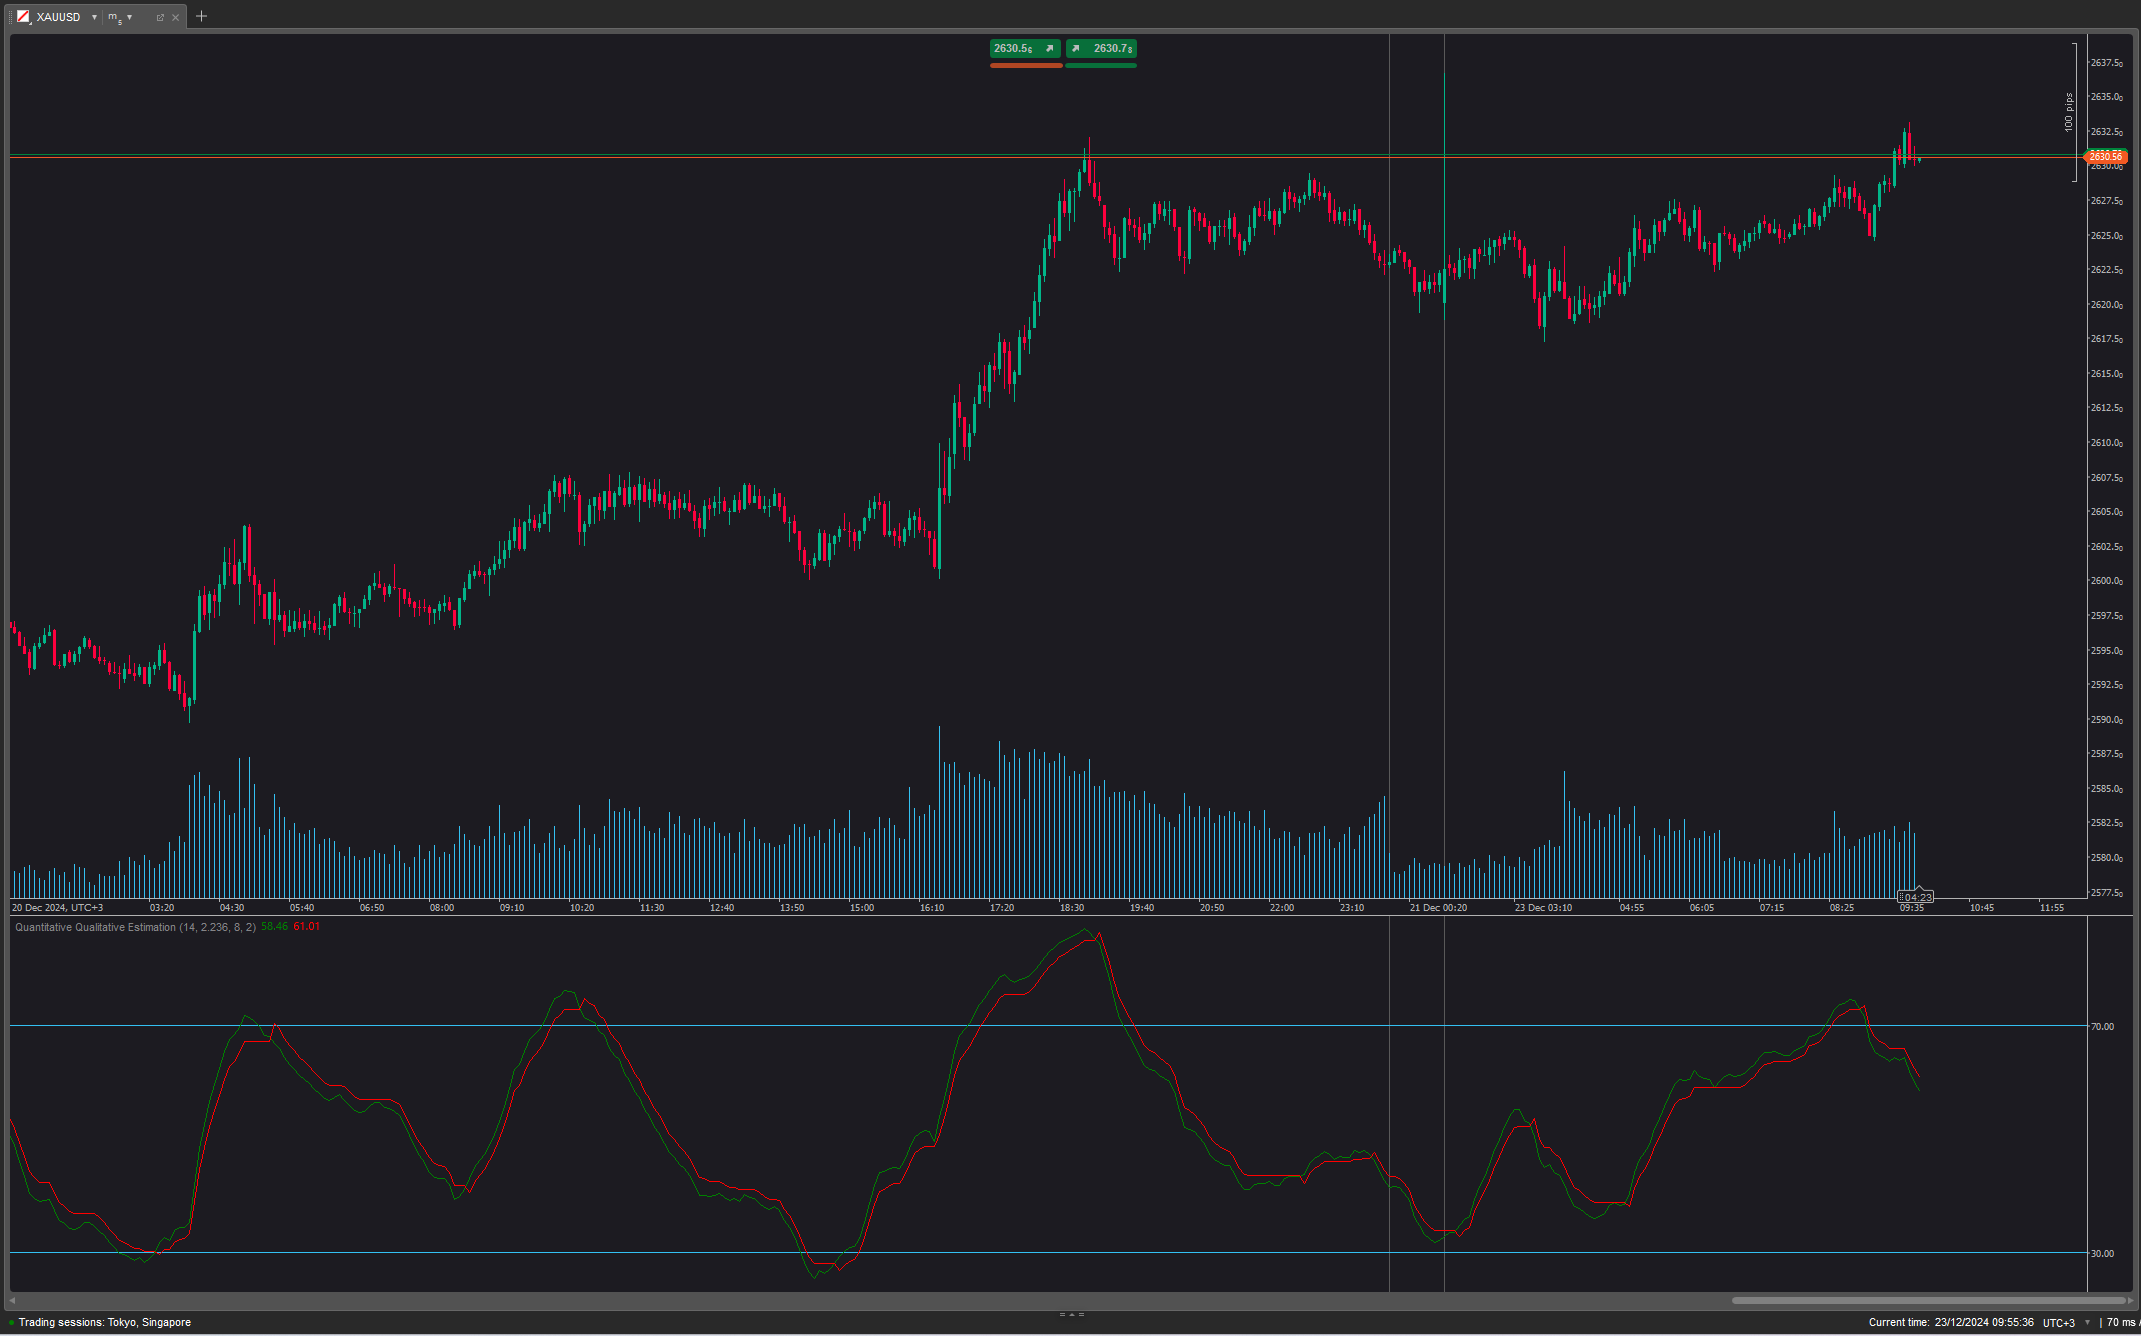
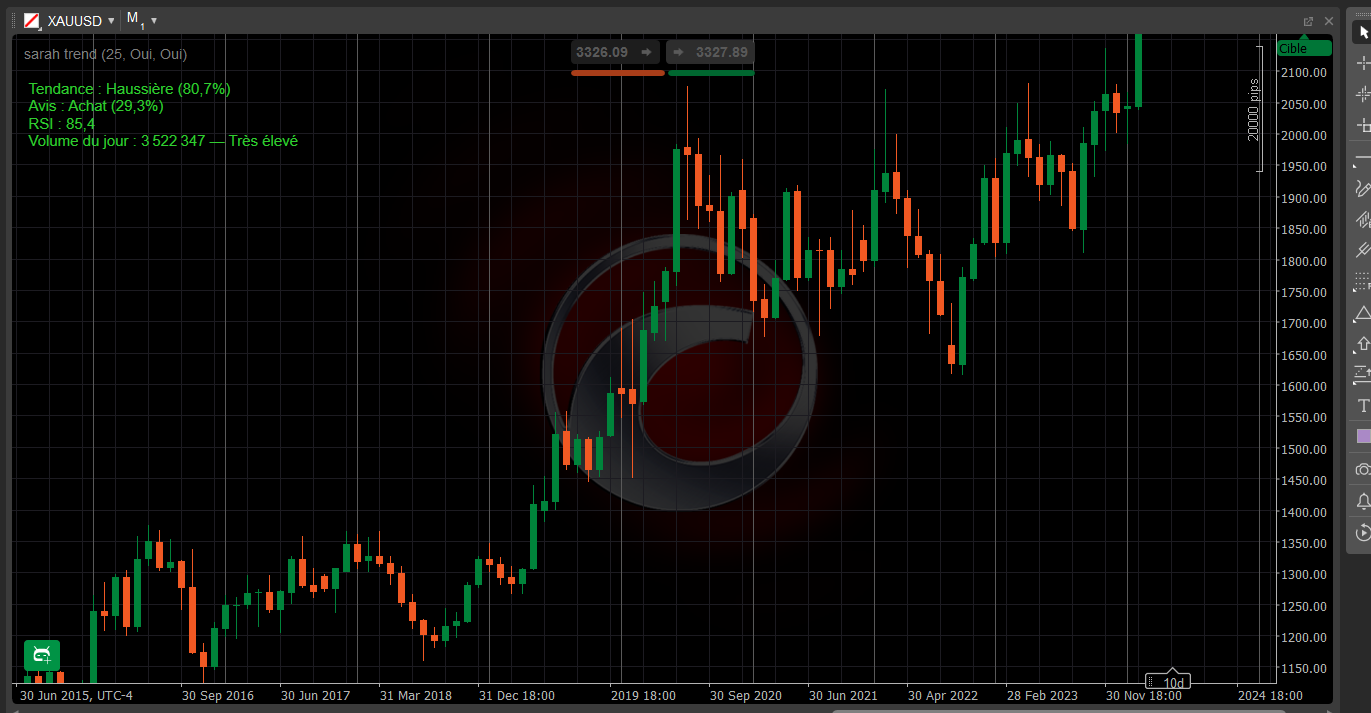
This trend-following strategy is designed to identify strong market trends using Exponential Moving Averages (EMAs), MACD, and ADX. It generates buy and sell signals based on momentum and trend strength.
How It Works
1️⃣ Identifying Trend Direction
- Fast EMA (21) and Slow EMA (50) determine the overall trend direction:
- Bullish Trend → Fast EMA is above the Slow EMA
- Bearish Trend → Fast EMA is below the Slow EMA
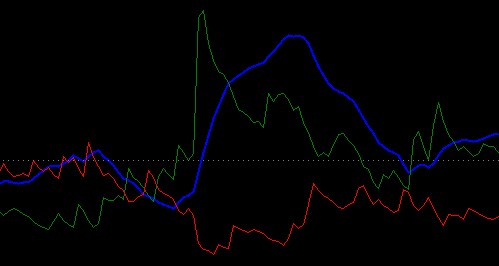
2️⃣ Measuring Trend Momentum (MACD Histogram)
- The MACD histogram confirms momentum:
- Bullish Momentum → MACD histogram is above zero
- Bearish Momentum → MACD histogram is below zero
3️⃣ Checking Trend Strength (ADX Indicator)
- The ADX (14) measures trend strength:
- Strong Trend → ADX is above 25
- Weak Trend → ADX is below 25 (no signals)
Trade Execution
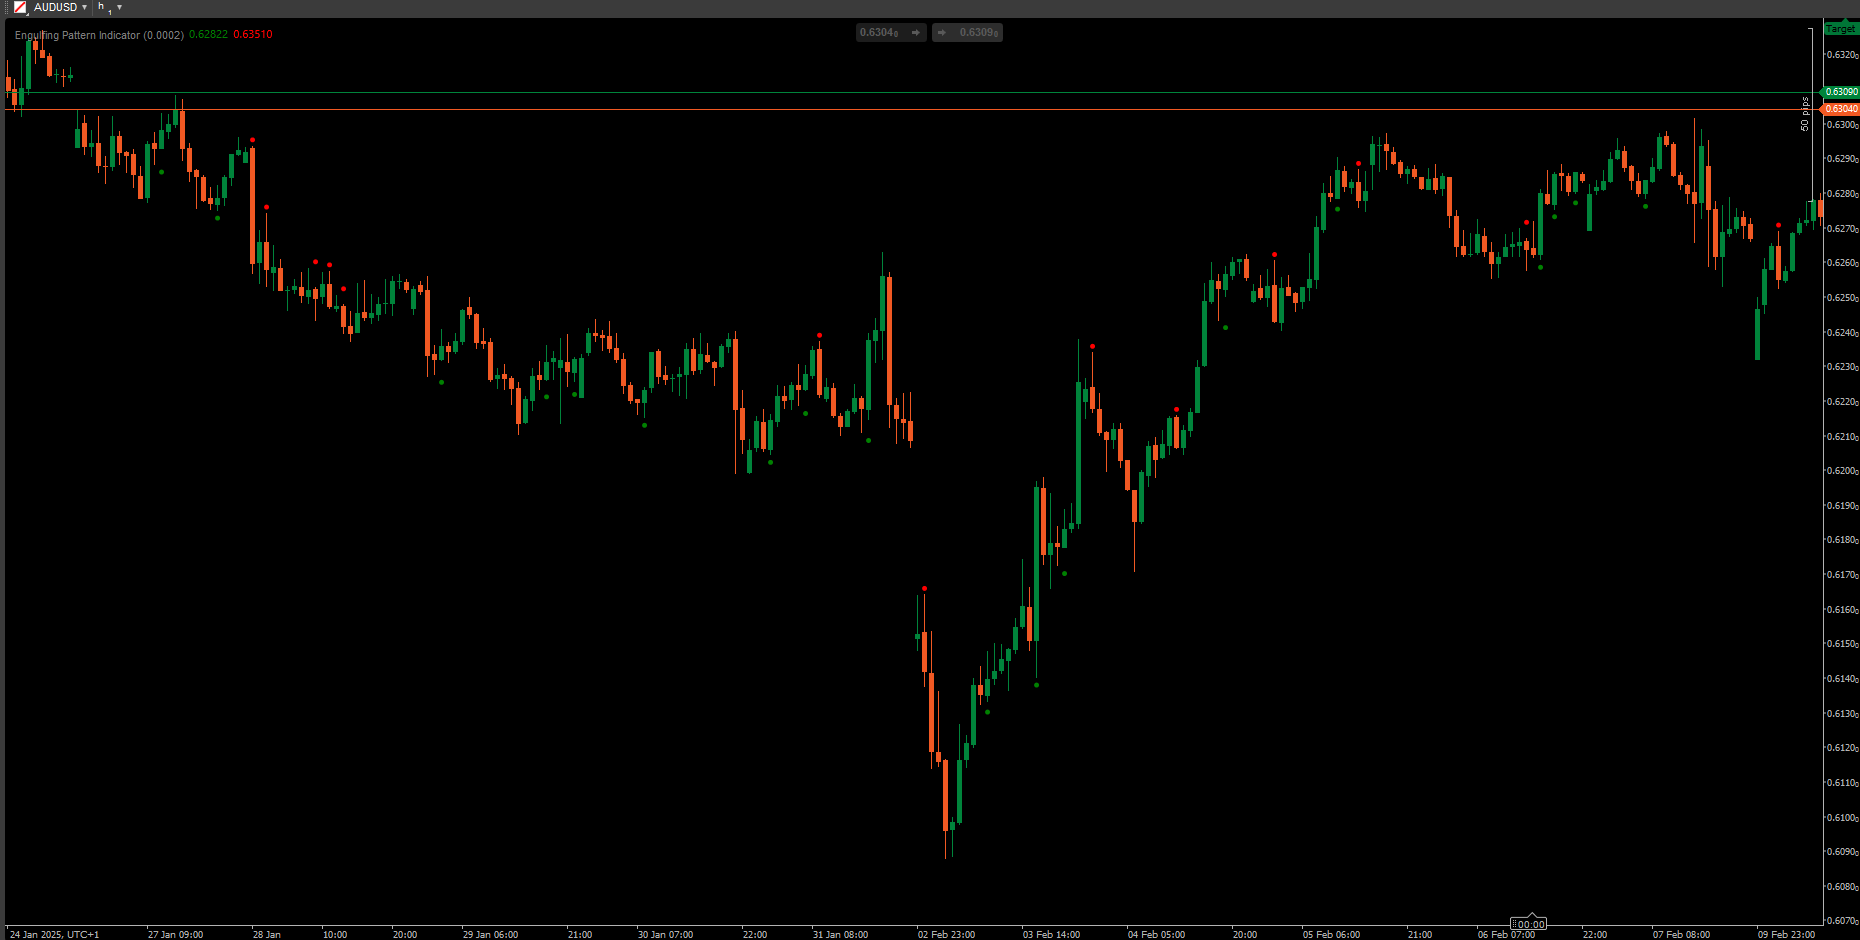
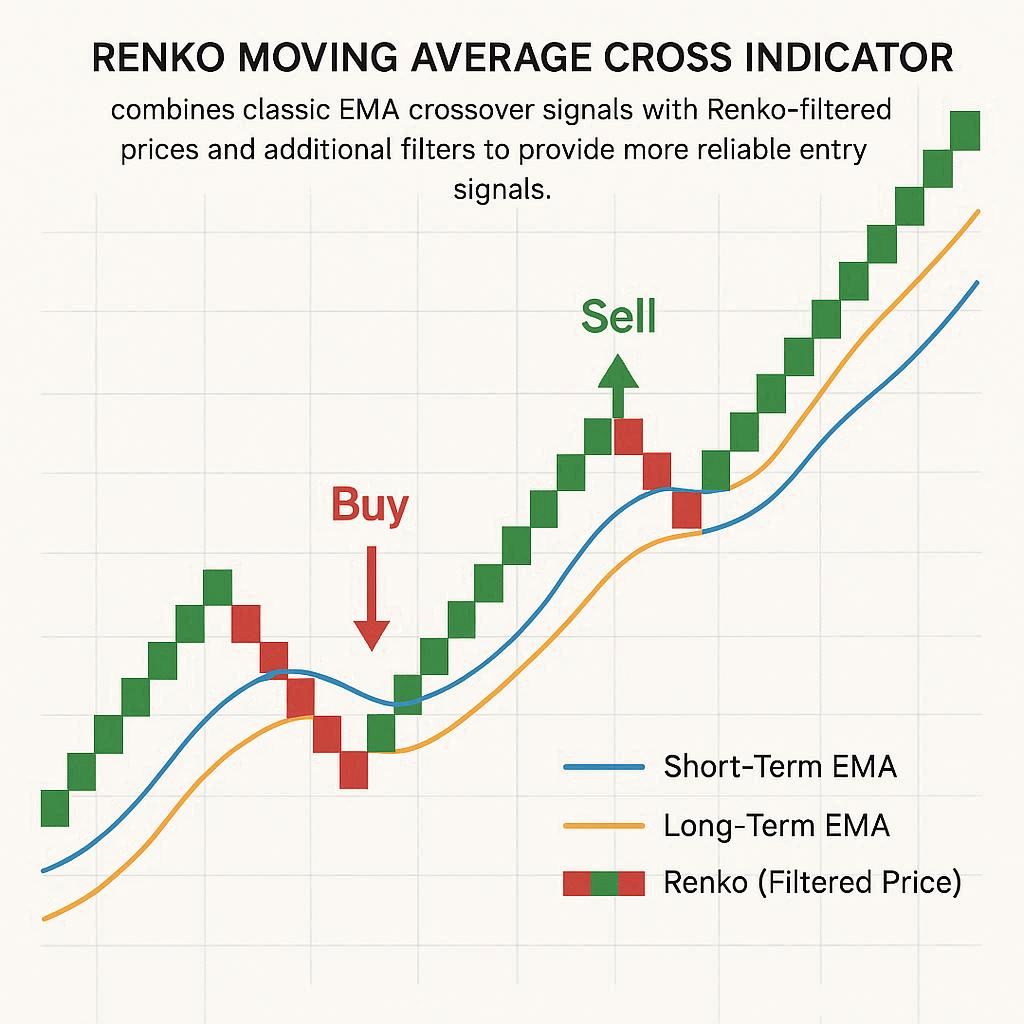
✅ Buy Signal (Bullish Entry)
- Fast EMA > Slow EMA (Uptrend)
- MACD Histogram > 0 (Momentum confirmation)
- ADX > 25 (Strong trend)
- 🔹 Buy arrow appears below the low price
❌ Sell Signal (Bearish Entry)
- Fast EMA < Slow EMA (Downtrend)
- MACD Histogram < 0 (Momentum confirmation)
- ADX > 25 (Strong trend)
- 🔻 Sell arrow appears above the high price
Key Features
✔ Avoids weak trends using ADX
✔ Filters false signals with MACD confirmation
✔ Adjustable parameters for better customization
This indicator helps traders ride strong trends while avoiding weak market conditions. 🚀
More from this author


You may also like


.jpg)
!["[CB] Pivot Points Pro" logo](https://market-prod-23f4d22-e289.s3.amazonaws.com/8227035a-1386-44e8-8335-c56ee434a8fd_ctrader-pivot-point-indi.png)
!["[Stellar Strategies] Wave Trend Pro" logo](https://market-prod-23f4d22-e289.s3.amazonaws.com/8c93438a-6b0a-4026-93b2-0694329a3bc1_cT_cs_4141285_EURUSD_2025-04-25_17-52-31.png)

!["[Stellar Strategies] Market Session Ultimate" logo](https://market-prod-23f4d22-e289.s3.amazonaws.com/92b85b76-697c-4a8f-811f-ddd63eb8f9c8_cTrader_oSHtUgCtNJ.png)