Indicator
NAS100
Indices
NZDUSD
XAUUSD
Commodities
Stocks
Forex
EURUSD
GBPUSD
Crypto
BTCUSD
USDJPY
RT True Strength Index
"RT True Strength Index" logo
25/09/2025
1
Desktop
Since 25/09/2024
Sales
19
"RT True Strength Index" uploaded image"RT True Strength Index" uploaded image

Introducing the True Strength Index (TSI) indicator, a powerful tool designed to enhance your trading strategy by providing clear insights into market momentum and trend strength.

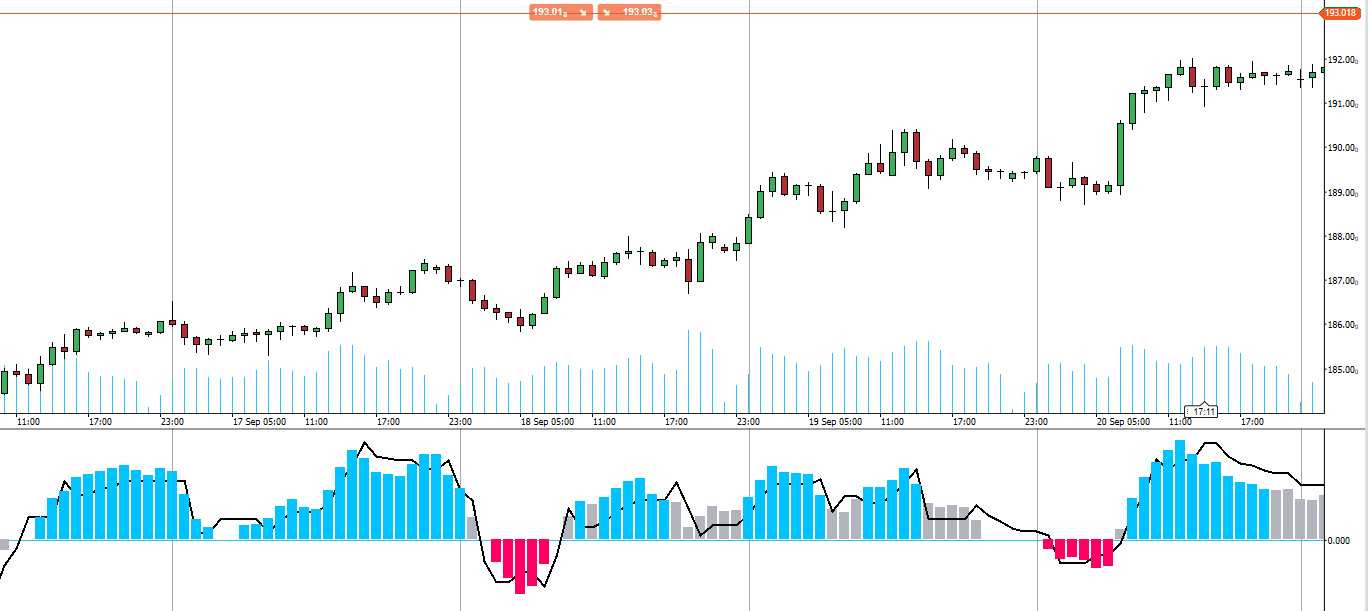
The TSI indicator measures the underlying strength of price movements, smoothing out market noise to give you a more accurate picture of trend direction. By highlighting overbought and oversold conditions, TSI helps you identify potential reversal points and confirm trend continuations.

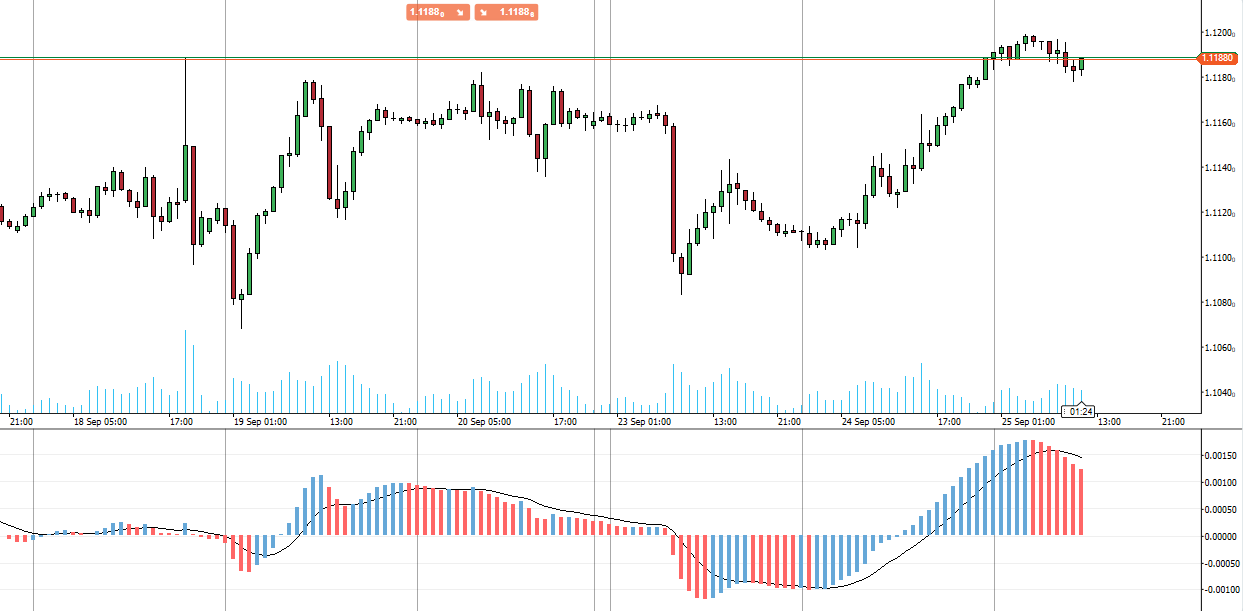
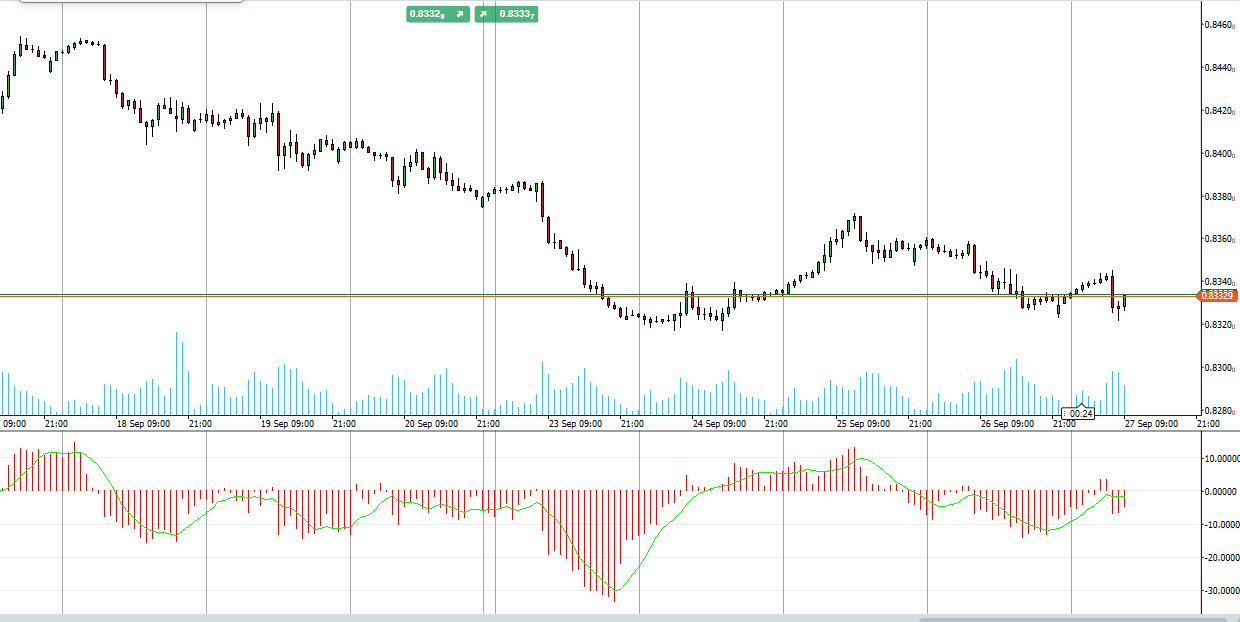
TSI uses moving averages of the underlying momentum of a financial instrument. Momentum is considered a leading indicator of price movements, and a moving average characteristically lags behind price. The TSI combines these characteristics to create an indication of price and direction more in sync with market turns than either momentum or moving average.

Perfect for traders seeking to refine their analysis and improve decision-making, the TSI indicator offers a reliable and intuitive way to gauge market dynamics. Upgrade your trading toolkit with the True Strength Index for superior trading performance.

More from this author
Indicator
NAS100
NZDUSD
XAUUSD
+13
RT MACD
Customize the MACD! Choose colors, get real-time tick updates, and see crossover points for enhanced trading precision.
Indicator
NAS100
NZDUSD
XAUUSD
+13
RT Chandelier Exit
Optimize exits with Chandelier Exit! Visualize stop-loss points dynamically for improved trading precision and safety.
Indicator
NAS100
NZDUSD
Breakout
+12
RT ATR Bands
Enhance trading with ATR Bands! Visualize market volatility using dynamic upper and lower ATR bands for precise decision
Indicator
NAS100
NZDUSD
XAUUSD
+11
RT VWAP
Unlock VWAP in cTrader! Choose anchor periods, price sources, and display deviation bands with real-time tick updates.
RT TradingView ATR
Upgrade to ATR-RMA! Experience the precise ATR using Relative Moving Average for accurate volatility analysis in cTrader
Indicator
NAS100
NZDUSD
XAUUSD
+10
RT Qualitative Quantity Estimation
Unlock trading precision with QQE! Dual QQE indicators with a Bollinger Bands zero line provide clear buy/sell signals.
Indicator
NAS100
NZDUSD
XAUUSD
+11
RT Consolidation Zones
Identify and trade breakouts with Consolidation Zones! Visualize price consolidation areas for trading opportunities.
Indicator
NAS100
NZDUSD
XAUUSD
+10
RT Standard Deviation Channel_noSourceCode
Visualize trends with Standard Deviation Channel! Display median, and add customizable upper/lower deviation channels.
Indicator
Indices
RSI
XAUUSD
+9
RT Stochastic RSI PRO
Unlock Stochastic RSI PRO in cTrader! Overlay RSI, highlight zones, and identify divergences with customizable settings.
Indicator
NAS100
NZDUSD
XAUUSD
+10
RT Moving Average PRO v1.1
Customize your Moving Average! Choose any timeframe and price source for precision and flexibility in your analysis.
Indicator
NAS100
NZDUSD
XAUUSD
+13
RT MACD Histogram
Enhance MACD Histogram! Visualize bull and bear price changes with vibrant colors for clearer, more insightful trading.
Indicator
NAS100
Indices
NZDUSD
+9
RT Relative Moving Average
Bring the RMA to cTrader! This is the Relative Moving Average from TradingView.
Indicator
NAS100
NZDUSD
XAUUSD
+12
RT Bollinger Bands Cloud
Visualize Bollinger Bands with a colored cloud for clarity. Enhance your trading precision with this dynamic indicator!
Indicator
NAS100
NZDUSD
XAUUSD
+10
RT Time Segmented Volume
Enhance trading with TSV! Analyze volume flow and price trends using the powerful Time Segmented Volume indicator.
You may also like
VWAP Tank Btn
Custom Vwap Indicator
ScalpingSignalIndicator
Scalping signals with EMA/RSI/ATR logic. Visual cloud shows precise entry and exit zones. Built for M1/M5 scalpers.
Indicator
RSI
Breakout
Supertrend
Swing Levels
🔍 Automatically detect support and resistance levels based on "swings" or pivots
Indicator
Indices
Breakout
Commodities
+3
Trend Lines Auto - FXMaster
Auto Trend Line Indicator for cTrader
Side Volume Profile
Right-anchored cTrader Volume Profile with VAH/VAL/POC, LVZ, top volume+EMA, themes, and fast, readable visuals.
HTF Candles
🌟 HTF indicator for cTrader! Real-time higher timeframe candles (1W-1H) on your chart.
Open Trade PipsV1
This indicator tracks the unrealised amount of pips in your open positions.
Indicator
RSI
Breakout
XAUUSD
+5
Shielded Trend
Buy/Sell signals filtering noise, color-coded trends & strength shield 🛡️. Trade only with POWER ⚡
Indicator
Indices
Prop
Commodities
+3
OBScope
A cutting-edge indicator designed to detect and visualize high-probability zones based on swing highs, swing lows.
Indicator
RSI
Signal
MACD
+1
Long Wick
Identify potential reversal points in the market by detecting candles with exceptionally long upper or lower wicks
FVG
The Indicator is a powerful tool for price-action traders seeking to identify and exploit short-term imbalances.
FREEE Tradingview Economic Calendar on Chart
Customizable window inside your platform, access to any website Calendar Was Free for early users now -50%
Market_Session_Forex
Market Sessions
Donchian Channel Pro
Tracks N-period highs/lows, HTF overlay, HUDs with ADX, RSI, session clocks. Customizable for precise trading.
Fibonacci Pitchfan
Powerful all-in-one tool for traders seeking a clear, dynamic view of market structure. By merging pivots, trendlines &
Renko Reversal
Renko Reversal catches powerful wick rejections on cTrader.
E7 BBKG Indicator
E7 BBKG indicator with 80% plus accuracy used to show both, possible reversal and trend.
Ichimoku Kinko Hyo
Ichimoku Kinkō Hyō with fixed shift to 25 as Ctrader calculate it from 0 and values was wrong for Chikou Span and Kumo.